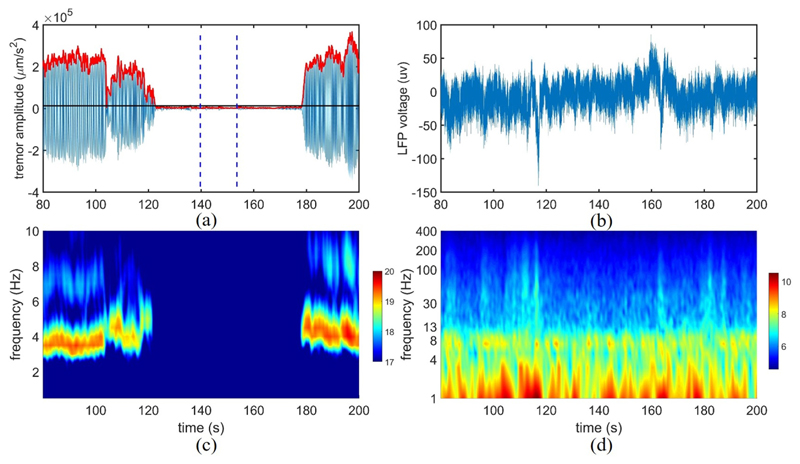
Fig. 2.
(a) Tremor labeling based on acceleration signal, (b) the corresponding LFP. The red curve shows the envelope of the filtered acceleration around the tremor frequency, while the two vertical lines define the non-tremor period as baseline for threshold setting. The horizontal black line represents the threshold to separate the tremor and non-tremor periods; (c) Time-frequency decomposition of the acceleration signal, (d) and corresponding LFP (the y-axis is displayed in log scale). The color bars on the right indicate the log of the absolute power.

