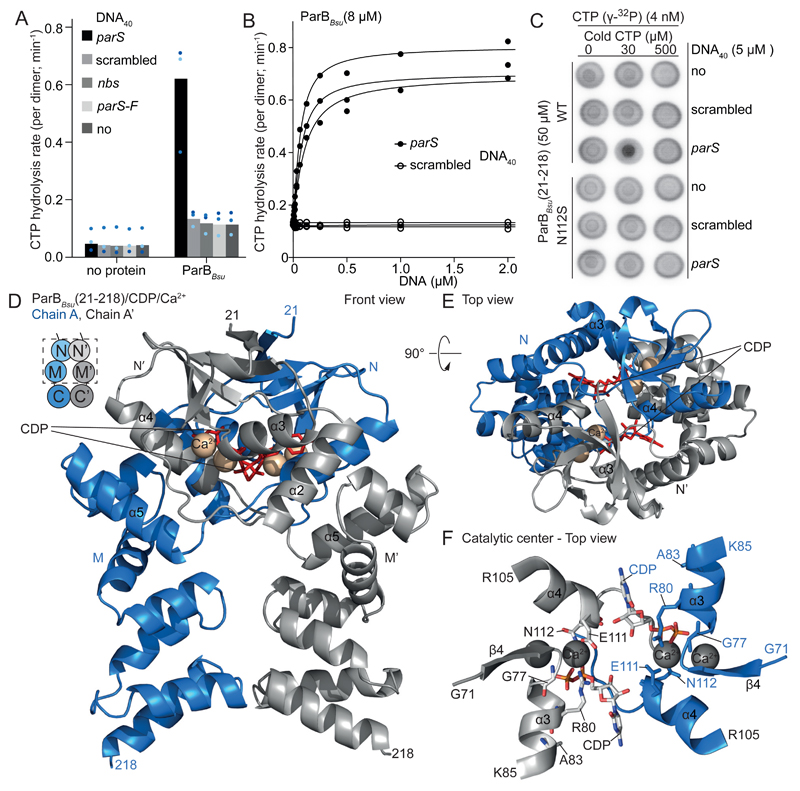
Fig. 2. ParB CTP hydrolysis.
(A) CTP hydrolysis measured by colorimetric detection of inorganic phosphate using malachite green. Mean values from three repeat measurements. Data points are shown as dots. (B) CTP hydrolysis by ParBBsu dimers with increasing DNA concentrations. Data points and fits of three repeat measurements. (C) Membrane-spotting showing parS-stimulated cooperative CTP binding. (D, E) Crystal structure of a ParBBsu(21-218)/CDP/Ca2+ dimer. (F) Catalytic center in ParBBsu(21-218)/CDP/Ca2+.

