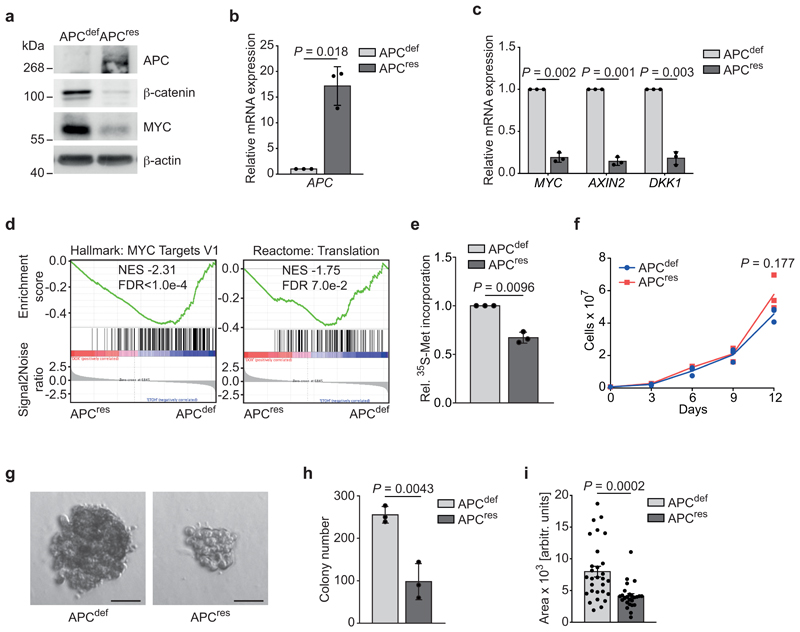
Figure 1. Restoration of APC expression suppresses translation and anchorage-independent growth.
(a) Immunoblot of SW480TetOnAPC cells after 48 h treatment with doxycycline (APCres) or ethanol (APCdef), representative of three independent experiments with similar results.
(b) mRNA expression of APC in SW480TetOnAPC cells (96 h ethanol or doxycycline, respectively) analysed via qPCR (n = 3 biologically independent experiments); unpaired, two-tailed t-test.
(c) mRNA expression of WNT pathway target genes MYC, AXIN2, DKK1 in SW480TetOnAPC cells treated as described in (b) analysed via qPCR (n = 3 biologically independent experiments); unpaired, two-tailed t-test.
(d) RNA-sequencing followed by GSEA of gene expression changes in APCdef and APCres cells (48 h ethanol and doxycycline, respectively). Enrichment plots of indicated gene sets are displayed (n = 3 biologically independent experiments). Calculation of the normalised enrichment score (NES) is based on a weighted running sum statistic and computed as part of the GSEA methodology [55]. A Kolmogorov-Smirnov test with 1,000 permutations was used to calculate P values that were then corrected for multiple testing using the Benjamini-Hoechberg procedure (FDR).
(e) 35S-methionine labelling of APCdef and APCres cells (72 h doxycycline). Incorporated radioactivity was measured by scintillation counting. Data show mean ± s.d. (n = 3 biologically independent experiments); unpaired, two-tailed t-test.
(f) Cumulative growth curve of APCdef and APCres cells treated with doxycycline or ethanol, respectively. Data show mean ± s.d. (n = 3 biologically independent experiments); unpaired, two-tailed t-test.
(g) Anchorage-independent growth of APCdef and APCres colonies. Colonies were grown over ten days, with fresh ethanol or doxycycline added every third day. Representative colonies are shown. Scale bars = 50 μM.
(h) Quantification of size of colonies from (g). Data show mean ± s.d. of all colonies counted (n = 29 for APCdef and n = 25 for APCres); unpaired, two-tailed t-test.
(i) Quantification of number of colonies from (g). Data show mean ± s.d. (n = 3 biologically independent experiments); unpaired, two-tailed t-test.
Unprocessed immunoblots are shown in Source Data Figure 1.

