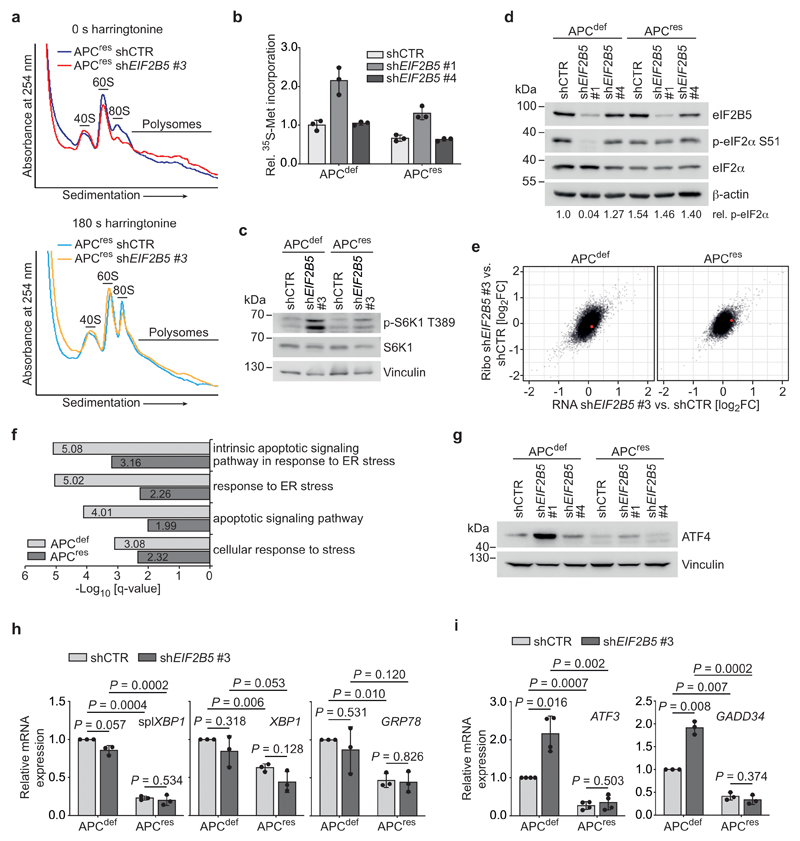
Extended Data Fig. 3. eIF2B5 depletion induces an ISR.
(a) Polysome profiling of shCTR-transduced and eIF2B5-depleted APCres cells (72 h doxycycline) incubated with harringtonine for 0 s (upper) and 180 s (lower). Data (0 s harringtonine) are representative of three independent experiments with similar results, 180 s harringtonine assay was performed once.
(b) 35S-methionine labelling of shCTR-transduced or eIF2B5-depleted APCdef and APCres cells (96 h ethanol or doxycycline, respectively). Incorporated radioactivity was measured by scintillation counting. Data represent mean ± s.d. (n = 3 technical replicates), representative of two independent experiments with similar results.
(c) Immunoblots of cells described in (b), representative of two independent experiments with similar results.
(d) Immunoblots of cells described in (b), representative of two independent experiments with similar results. p-eIF2α S51 levels, relative to total eIF2α, are shown below the immunoblot.
(e) Plots documenting mean log2 fold change of total mRNA (x-axis, “RNA”) and ribosome-associated mRNA (y-axis, “Ribo”) of eIF2B5-depleted APCdef and APCres cells (96 h ethanol or doxycycline, respectively). MYC is highlighted in red (n = 3 biologically independent experiments).
(f) Gene ontology (GO) analyses of ribosomal profiling data from (e). P values, adjusted for multiple testing, are shown for over-representation of GO terms among genes upregulated after eIF2B5 knockdown in APCdef and APCres cells. P values were calculated using GOrilla [58, 59].
(g) Immunoblot of cells as described in (b), representative of two independent experiments with similar results.
(h) mRNA expression of spliced XBP1, GRP78 and unspliced XBP1 of cells described in (b). Data show mean ± s.d. (n = 3 biologically independent experiments); unpaired, two-tailed t-test.
(i) mRNA expression of ATF3 and GADD34 of cells described in (b). Data show mean ± s.d. (ATF3 n = 4, GADD34 n = 3 biologically independent experiments); unpaired, two-tailed t-test.
Unprocessed immunoblots are shown in Source Data Extended Data 3.

