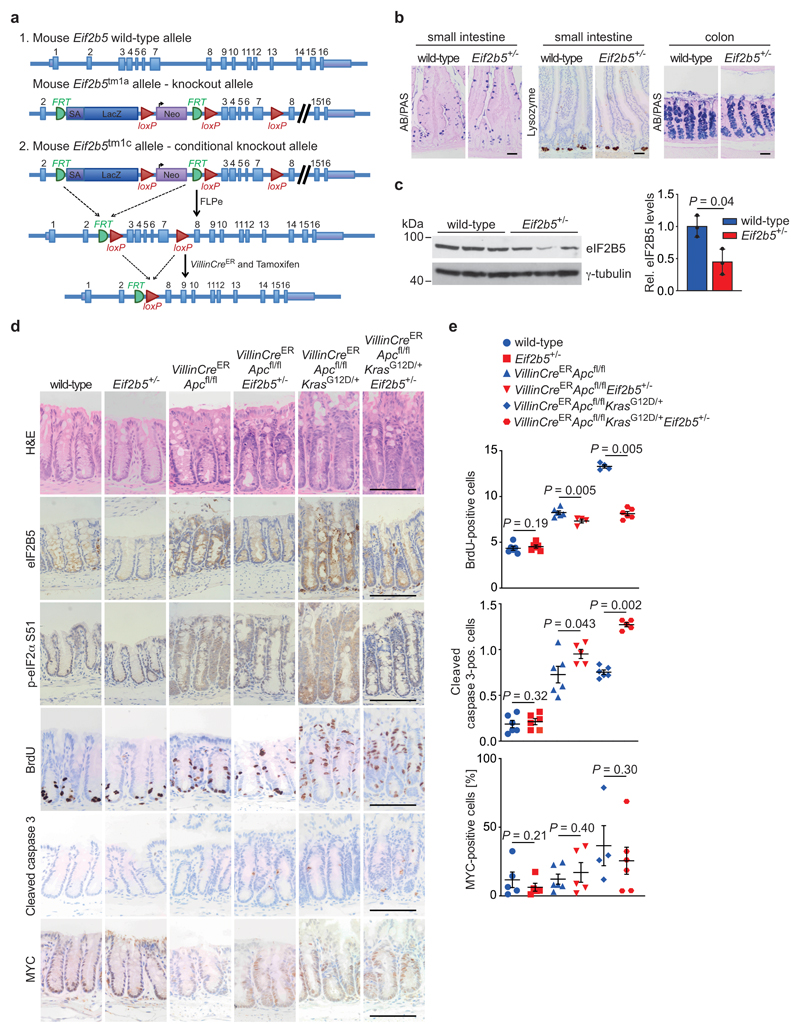
Extended Data Fig. 7. Eif2b5 heterozygosity suppresses hyperproliferation upon loss of Apc in colon.
(a) Illustration of generation of Eif2b5 knockout mice used in the study.
(b) Immunohistochemical AB/PAS and lysozyme staining of wild-type and Eif2b5+/- mice in small intestinal and colon tissue, representative of three biologically independent mice of each genotype with similar results (n = 3). AB/PAS staining represents goblet cells, lysozyme staining represents Paneth cells. Scale bars = 50 μm.
(c) Immunoblot of intestinal epithelial extracts from mice of the indicated genotypes. Each lane represents one separate mouse from the relevant group (left). Immunoblot was performed once. Quantification of eIF2B5 protein levels, normalised to (γ-tubulin (right). Data show mean ± s.d. (n = 3 biologically independent mice); one-tailed Mann-Whitney U test.
(d) Representative H&E-, eIF2B5-, p-eIF2α S51-, BrdU-, cleaved caspase 3- and MYC-stained sections of colons from mice of the indicated genotypes. Scale bars = 100 μm.
(e) Graphs documenting the number of cells positive for BrdU, cleaved caspase 3, and MYC in immunostained colon sections from mice of the indicated genotypes. The number of BrdU-positive cells per half crypt (top panel), and the number of cells per full crypt staining positive for cleaved caspase 3 (middle panel) or MYC (bottom panel), were scored in 25 crypts per mouse in at least four biologically independent mice (n = 4 for BrdU staining of VillinCreERApcfl/flEif2b5+/- and VillinCreERApcfl/flKrasG12D/+, n = 5 for cleaved caspase 3 staining of VillinCreERApcfl/flEif2b5+/- and VillinCreERApcfl/flKrasG12D/+Eif2b5+/-, n = 4 for MYC staining of VillinCreERApcfl/flKrasG12D/+, n = 5 for MYC staining of wild-type, Eif2b5+/- and VillinCreERApcfl/fl, n = 6 for all other stainings and genotypes). Data show mean ± s.e.m.; one-tailed Mann-Whitney U or one-way ANOVA test.
Unprocessed immunoblots are shown in Source Data Extended Data 7.

