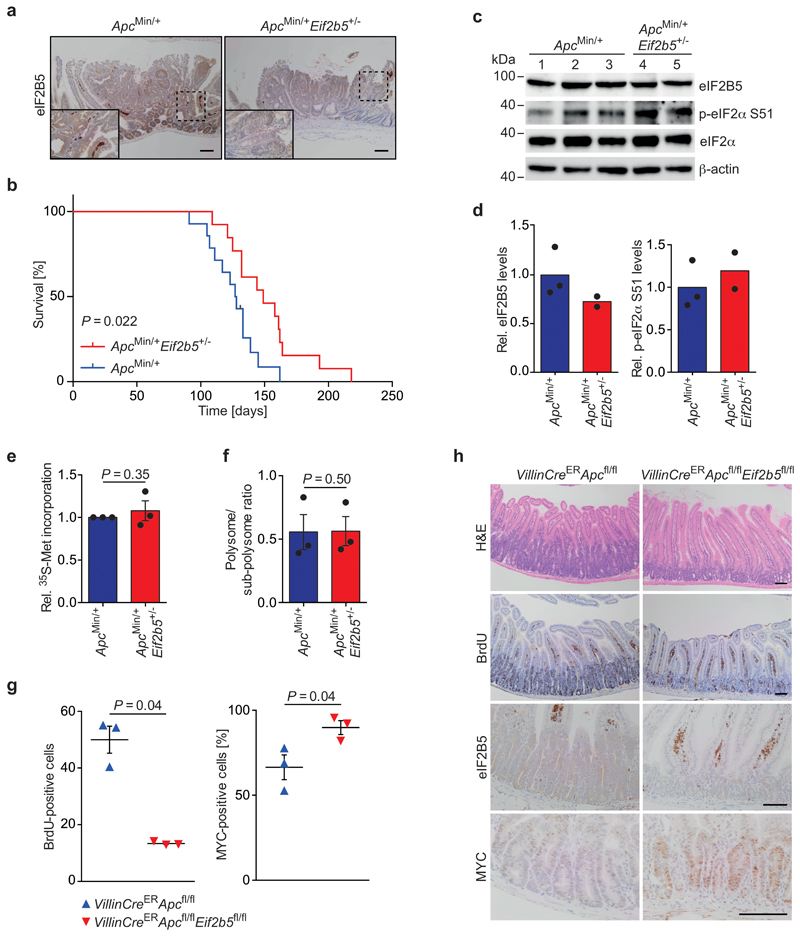
Extended Data Fig. 8. Eif2b5 is haplo-insufficient for intestinal tumourigenesis driven by Apc loss.
(a) Immunohistochemical staining of eIF2B5 in ApcMin/+ and ApcMin/+Eif2b5+/- small intestines, representative of three biologically independent mice each with similar results. Scale bars = 100 μm.
(b) Kaplan-Meier curve of ApcMin/+ (n = 14 biologically independent mice) compared with ApcMin/+Eif2b5+/- (n = 13 biologically independent mice) mice. One of the ApcMin/+ mice was censored due to a mammary tumour. P value was calculated using a Log-rank test.
(c) Immunoblot of organoids established from outgrowing tumours of ApcMin/+ and ApcMin/+Eif2b5+/- mice. Each lane represents one mouse (ApcMin/+ n = 3, ApcMin/+Eif2b5+/- n = 2 biologically independent mice). Immunoblot was performed once.
(d) Quantification of eIF2B5 levels, relative to β-actin, and p-eIF2α S51 levels, relative to total eIF2α, of organoids described in (c). Data show mean ± s.d. (ApcMin/+ n = 3, ApcMin/+Eif2b5+/- n = 2 biologically independent mice).
(e) 35S-methionine labelling of organoids described in (c). Incorporated radioactivity was measured by scintillation counting. Data show mean of ± s.d. (n = 3 biologically independent mice); one-tailed Mann Whitney U test.
(f) Quantification of polysome to sub-polysome fractions in polysome profiles from organoids described in (c). Data show mean of ± s.d. (n = 3 biologically independent mice); one-tailed Mann Whitney U test.
(g) Graphs documenting the number of BrdU-positive cells per half crypt, and number of MYC-positive cells per full crypt from mice of the indicated genotypes in the small intestine. Data were scored in 25 crypts per mouse. Data show mean ± s.e.m. (n = 3 biologically independent mice); one-tailed Mann Whitney U test.
(h) Representative H&E-, BrdU-, eIF2B5- and MYC-stained sections of small intestines from mice of the indicated genotypes. Mice were sampled four days post-induction. Scale bars = 100 μM.
Unprocessed immunoblots are shown in Source Data Extended Data 8.

