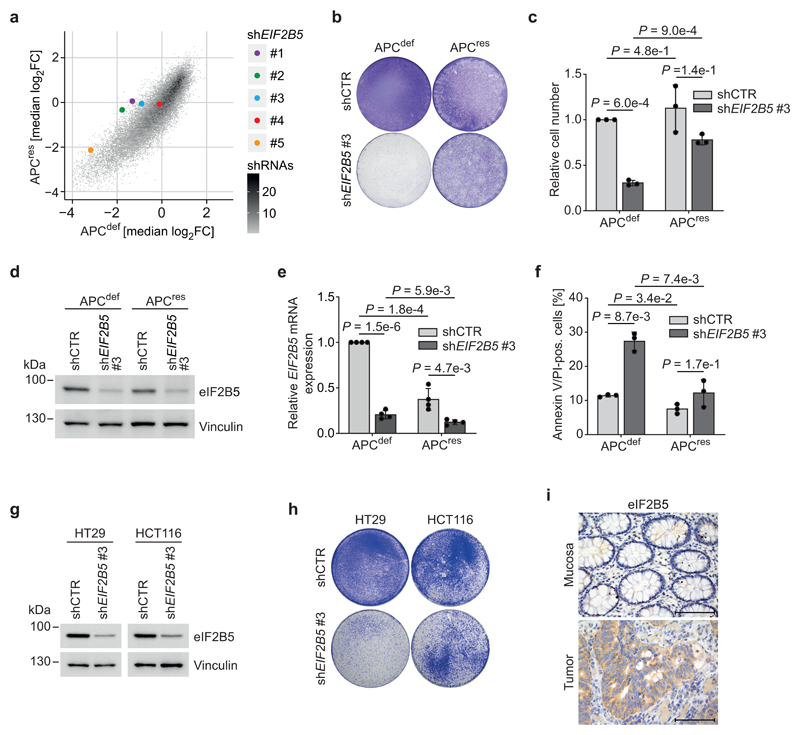
Figure 2. APC-deficient CRC cells depend on physiological eIF2B5 levels.
(a) Plot documenting log2 fold change of all shRNAs included in the screen in APCres versus APCdef cells (median of n = 3 biologically independent experiments) with five shRNAs targeting EIF2B5 shown in colour.
(b) Crystal violet staining of shCTR-transduced or eIF2B5-depleted APCdef and APCres cells (six days ethanol and doxycycline, respectively), representative of three biologically independent experiments with similar results. Cells were lentivirally infected with shRNAs targeting EIF2B5 or luciferase (shCTR).
(c) Relative number of shCTR-transduced or eIF2B5-depleted APCdef and APCres cells (seven days ethanol or doxycycline, respectively). Cell numbers were determined by staining with Hoechst and high-content microscopy imaging. Data show mean ± s.d. (n = 3 biologically independent experiments); unpaired, two-tailed t-test.
(d) Immunoblot of shCTR-transduced or eIF2B5-depleted APCdef and APCres cells (72 h ethanol or doxycycline), representative of five independent experiments with similar results.
(e) EIF2B5 mRNA levels determined via qPCR from cells described in (d). Data show mean ± s.d. (n = 4 biologically independent experiments); unpaired, two-tailed t-test.
(f) Annexin V/PI FACS analysis of shCTR-transduced or eIF2B5-depleted APCdef and APCres cells (96 h ethanol or doxycycline, respectively). Data shown mean ± s.d. (n = 3 biologically independent experiments); unpaired, two-tailed t-test.
(g) Immunoblot of shCTR-transduced or eIF2B5-depleted HT29 and HCT116 cells, representative of two independent experiments with similar results. Cells were lentivirally infected with shRNAs targeting EIF2B5 or luciferase (shCTR).
(h) Crystal violet staining of shCTR-transduced or eIF2B5-depleted HT29 and HCT116 cells, representative of two independent experiments with similar results.
(i) eIF2B5 staining of human CRC tumour tissue and normal mucosa (representative image of n = 10 biologically independent patients). Scale bars = 100 μm.
Unprocessed immunoblots are shown in Source Data Figure 2.

