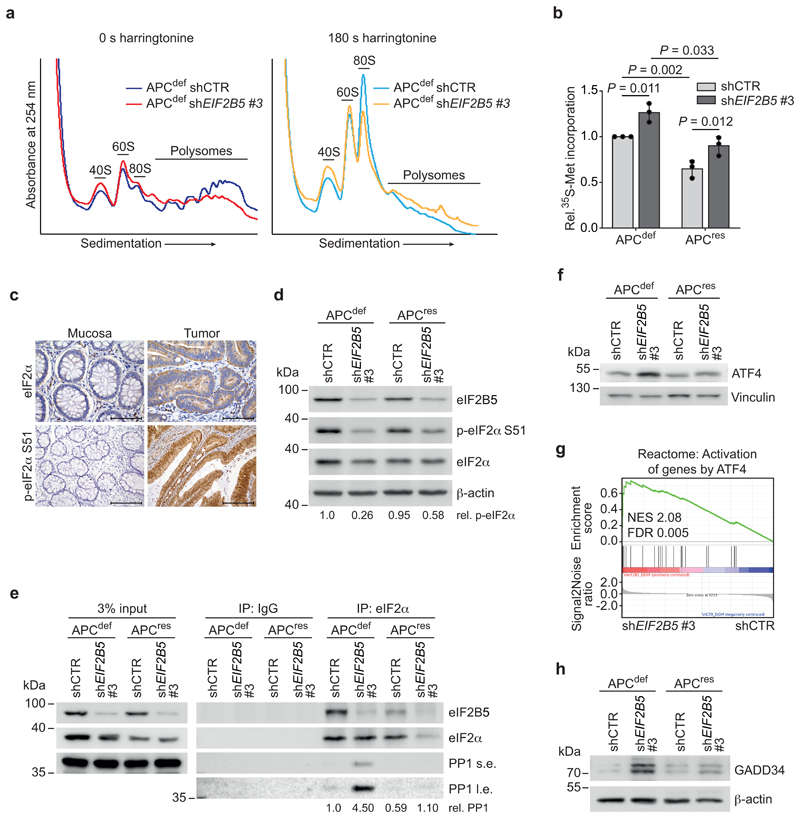
Figure 3. eIF2B5 controls translation initiation and limits global protein synthesis.
(a) Polysome profiling of shCTR-transduced and eIF2B5-depleted APCdef cells (72 h ethanol) incubated with harringtonine for 0 s (left) and 180 s (right) before harvest. 40S, 60S, 80S monosomal and polysomal fractions are indicated. Data (0 s harringtonine) are representative of three independent experiments with similar results, 180 s harringtonine assay was performed once.
(b) 35S-methionine labelling of shCTR-transduced and eIF2B5-depleted APCdef and APCres cells (72 h ethanol or doxycycline, respectively). Incorporated radioactivity was measured by scintillation counting. Data show mean ± s.d. (n = 3 biologically independent experiments); unpaired, two-tailed t-test.
(c) Total eIF2α and p-eIF2α S51 staining of human CRC tumour tissue and normal mucosa (representative image of n = 10 biologically independent patients). Scale bars = 100 μm.
(d) Immunoblot of shCTR-transduced and eIF2B5-depleted APCdef and APCres cells (96 h ethanol or doxycycline, respectively), representative of three independent experiments with similar results. p-eIF2α S51 levels, relative to total eIF2α levels, are shown below the immunoblot.
(e) Immunoprecipitation of eIF2α in shCTR-transduced or eIF2B5-depleted APCdef and APCres cells (72 h ethanol or doxycycline, respectively). As input, 3% of lysate was loaded. Proteins bound to eIF2α were detected by immunoblotting. Average levels of immunoprecipitated PP1 relative to immunoprecipitated eIF2α levels, normalised to input, are shown below (n = 2 biologically independent experiments). s.e. short exposition, l.e. long exposition.
(f) Immunoblot of shCTR-transduced or eIF2B5-depleted APCdef and APCres cells treated as described in (d), representative of three independent experiments with similar results.
(g) RNA-sequencing followed by GSEA of gene expression changes in shCTR-transduced or eIF2B5-depleted APCdef cells. Enrichment plot of a Reactome gene set representing an ATF4-dependent stress response is shown (n = 3 biologically independent experiments). Statistical analysis was done as described in Fig. 1d.
(h) Immunoblot of shCTR-transduced or eIF2B5-depleted APCdef and APCres cells treated as described in (d), representative of three independent experiments with similar results.
Unprocessed immunoblots are shown in Source Data Figure 3.

