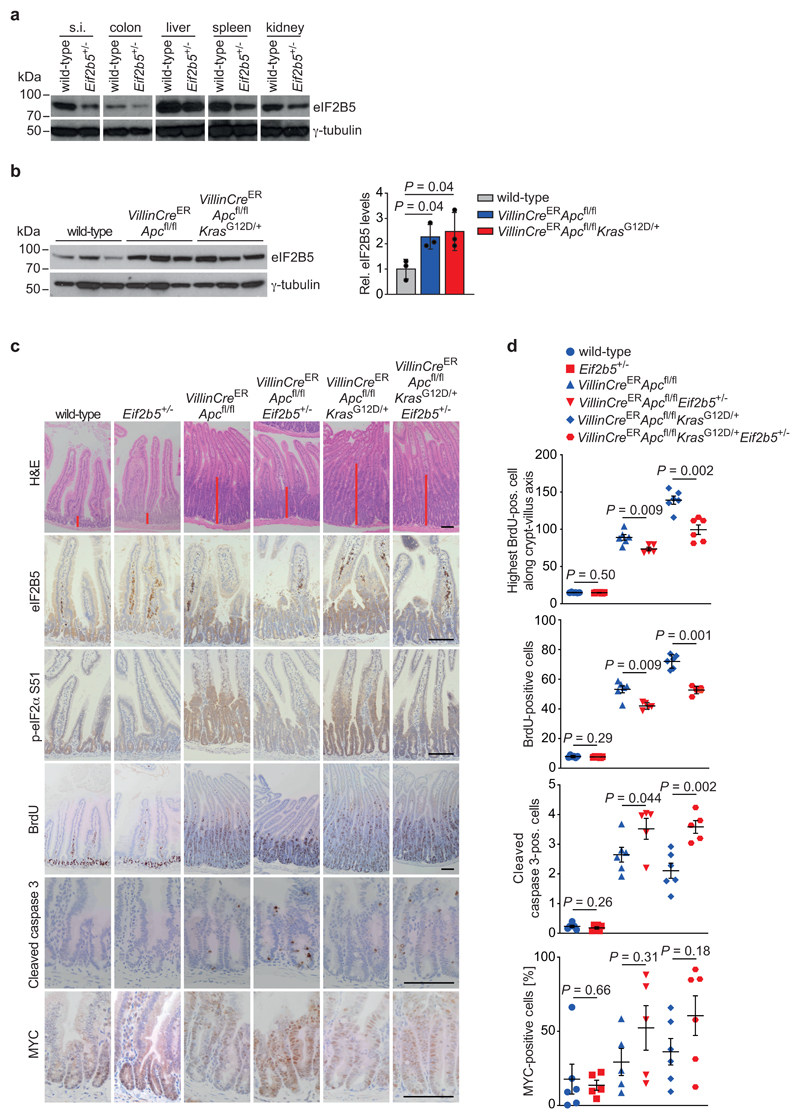
Figure 6. Physiological eIF2B5 levels are required for tumourigenesis driven by loss of Apc.
(a) Immunoblot of small intestine (s.i.), colon, liver, spleen and kidney from wild-type and Eif2b5+/- mice. Analysis was done once with one mouse per genotype.
(b) Immunoblot of intestinal epithelial extracts from mice of the indicated genotypes (left). Each lane represents one separate mouse of the relevant group. Immunoblot was performed once. Quantification of eIF2B5 protein levels, normalised to γ-tubulin (right). Data show mean ± s.d. (n = 3 biologically independent mice); one-tailed Mann-Whitney U test.
(c) Representative H&E-, eIF2B5-, p-eIF2α S51-, BrdU-, cleaved caspase 3-, and MYC-stained sections of small intestines from mice of the indicated genotypes. Mice were sampled four and three days post-induction, as described in Methods. Red bars indicate the length of the crypt (top panel). Scale bars = 100 μm.
(d) Graphs documenting the position of the highest BrdU-positive cell along the crypt-villus axis (top panel), the total number of cells staining positive for BrdU per half crypt (top middle panel), and the total number of cells per full crypt staining positive for cleaved caspase 3 (bottom middle panel) or MYC (bottom panel) in small intestines from mice of the indicated genotypes. Data were scored in 25 crypts per mouse in at least three biologically independent mice (n = 3 for highest BrdU-positive cell in wild-type and Eif2b5+/-, n = 5 for highest BrdU-positive cell in VillinCreERApcfl/flEif2b5+/-, n = 5 for BrdU staining in VillinCreERApcfl/flEif2b5+/-, n = 5 for cleaved caspase 3 staining in VillinCreERApcfl/flEif2b5+/- and VillinCreERApcfl/flKrasG12D/+Eif2b5+/-, n = 5 for MYC staining in Eif2b5+/-, VillinCreERApcfl/fl and VillinCreERApcfl/flEif2b5+/- mice, n = 6 for all other stainings and genotypes). Data show mean ± s.e.m.; one-tailed Mann-Whitney U.
Unprocessed immunoblots are shown in Source Data Figure 6.

