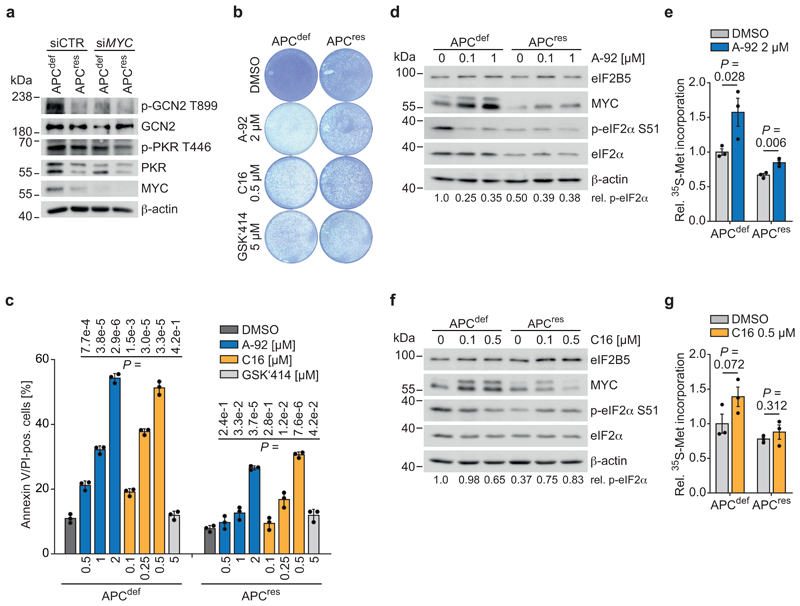
Figure 7. Inhibition of PKR and GCN2 phenocopies eIF2B5 knockdown.
(a) Immunoblot of APCdef and APCres cells upon siRNA-mediated knockdown of MYC (96 h ethanol or doxycycline, respectively), representative of two independent experiments with similar results. siRNA transfections were carried out using siCTR as non-targeting control or siMYC for 72 h.
(b) Crystal violet staining of APCdef and APCres cells (seven days ethanol or doxycycline, respectively) in the presence of the following eIF2α kinase inhibitors for 96 h: A-92 (GCN2 inhibitor), C16 (PKR inhibitor), GSK2606414 (PERK inhibitor, designated GSK‘414), representative of three independent experiments with similar results. DMSO was used as solvent control.
(c) Annexin V/PI FACS analysis of APCdef and APCres cells (five days ethanol or doxycycline, respectively) treated with DMSO or inhibitors of GCN2 (A-92), PKR (C16), or PERK (GSK'414) for 48 h at the indicated concentrations. Data show mean ± s.d. (n = 3 biologically independent experiments); unpaired, two-tailed t-test.
(d) Immunoblot of APCdef and APCres cells (72 h ethanol or doxycycline, respectively) after DMSO or A-92 treatment (2 h), representative of two independent experiments with similar results. p-eIF2α S51 levels, relative to total eIF2α levels, are shown below the immunoblot.
(e) 35S-methionine labelling of APCdef and APCres cells (96 h ethanol or doxycycline, respectively) treated with DMSO or GCN2 inhibitor A-92 for 48 h. Incorporated radioactivity was measured by scintillation counting. Data show mean ± s.e.m. (n = 3 biologically independent experiments); unpaired, two-tailed t-test.
(f) Immunoblots of APCdef and APCres cells (72 h ethanol or doxycycline, respectively) after DMSO or C16 treatment (2 h), representative of two independent experiments with similar results. p-eIF2α S51 levels, relative to total eIF2α levels, are shown below the immunoblot.
(g) 35S-methionine labelling of APCdef and APCres cells (96 h ethanol or doxycycline, respectively) treated with DMSO or PKR inhibitor C16 for 48 h. Incorporated radioactivity was measured by scintillation counting. Data show mean ± s.e.m. (n = 3 biologically independent experiments); unpaired, two-tailed t-test.
Unprocessed immunoblots are shown in Source Data Figure 7.

