FIGURE 3.
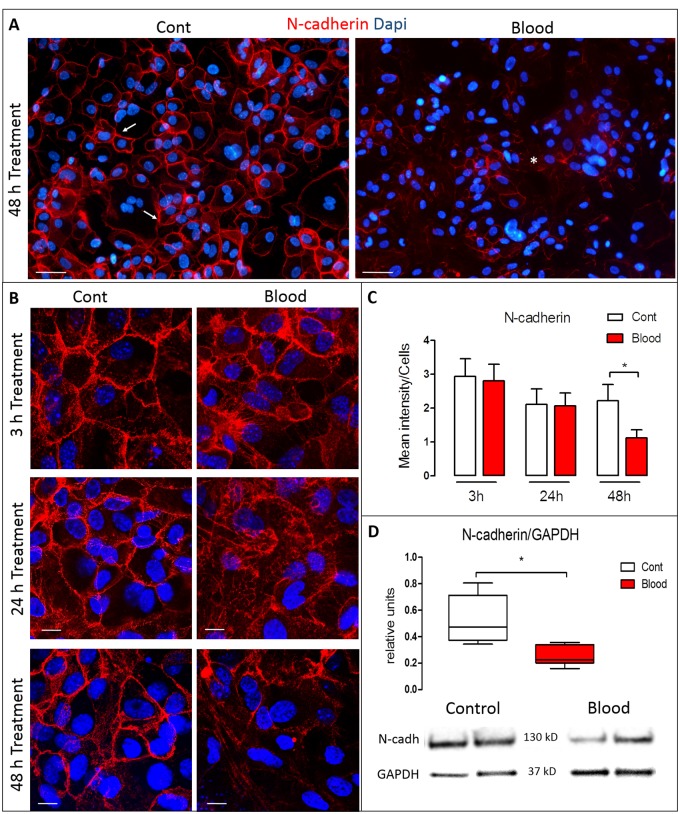
Time-dependent effect of blood in N-cadherin expression in the VZ. (A) Representative VZ cultures after 48 hours of control (left) or blood exposure (right). Compared with the prominent expression of N-cadherin (red) at the cell membrane in controls (arrows), N-cadherin expression was weaker and cytoplasmically dislocated after blood exposure (asterisk). (B) High magnification of VZ N-cadherin labeling in which 3 hours after exposure to blood, no changes were found in the expression of N-cadherin (red). However, after 24 hours of treatment, the expression of N-cadherin fragmented, with loss of the lattice-like configuration. After 48 hours, there was fragmentation, dislocation from the cell membrane, and loss of N-cadherin expression. (C) Quantification and comparison of N-cadherin expression between control and blood exposure, normalized by the total number of cells. There was a significant decrease in N-cadherin expression after 48 hours of blood treatment (p < 0.05). (D) N-cadherin protein levels quantified by Western blot normalized by GAPDH showing decreased levels of N-cadherin after 48 hours of blood treatment. Data are mean of the immunodensity/cells from 2 experiments with at least n = 6 wells at 3, 24, and 48 hours, respectively (C), and protein levels (N-cadherin/GAPDH) by Western blot (*p < 0.05) Data were analyzed from 2 experiments with n = 4 per condition (D). Nonparametric Mann-Whitney U test was used to analyze the data. Scale bars: All A panels = 50 μm; all B panels = 10 μm.

