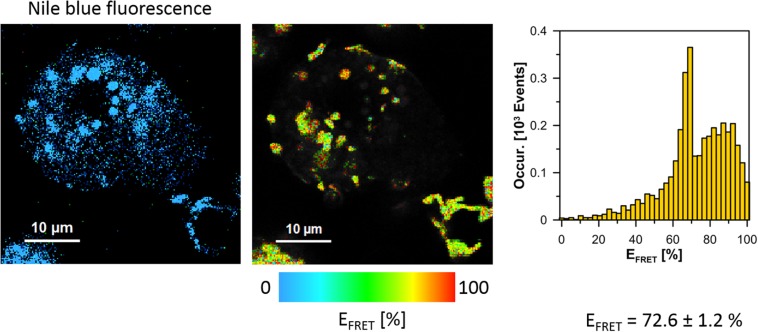
FIGURE 7.
Images illustrating Förster type excitation energy transfer (FRET) between SYTO9 immobilized on the surface of L. pneumophila cells (TF3/1 strain) and Nile Blue situated within A. castellanii cells. The left panel shows a fluorescence image of A. castellanii based on selective emission of Nile blue. The middle panel shows a map of FRET efficiency (L. pneumophila cells appear as bright spots). The right panel shows the FRET efficiency histogram representing an analysis of the map shown in the middle panel. The average FRET efficiency calculated over histograms in 6 experiments is given ± SD.

