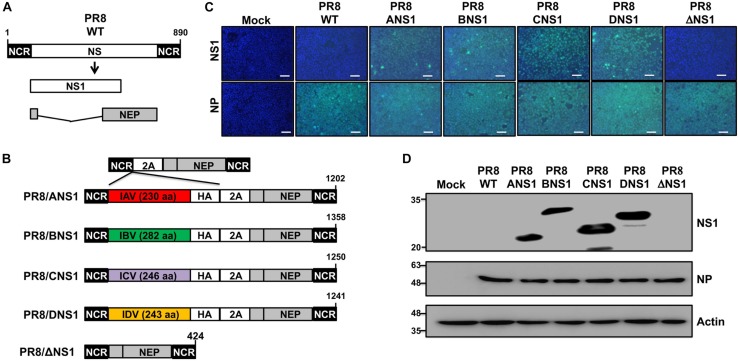
FIGURE 2.
Generation and characterization of recombinant PR8 viruses expressing different NS1 proteins. (A) Schematic representation of PR8 WT NS segment: PR8 WT NS segment and gene products (NS1 and NEP) are indicated. (B) Schematic representation of PR8 viruses expressing different NS1 proteins: a modified PR8 NS segment encoding NS1 and NEP from the same transcript (top) and the PR8 viruses encoding the NS1 proteins from PR8 (PR8/ANS1), IBV (PR8/BNS1), ICV (PR8/CNS1), or IDV (PR8/DNS1) with an HA epitope tag at the C-terminal of NS1, or an PR8 NS1 deficient virus (PR8/ΔNS1) are indicated. Black boxes at the beginning and end of each viral segment represent the viral 3′ and 5′ non-coding regions (NCR). Gray boxes indicate the viral NEP. White boxes show the different NS1 proteins. The PTV-1 2A autoproteolytic cleavage site used for the expression of NS1 and NEP from a single transcript is also indicated. (C) Immunofluorescence assay: MDCK cells (2.5 × 10⁵ cells/well, 24-well plate format, triplicates) were mock-infected or infected (MOI = 2) with WT or modified PR8 viruses expressing IAV (PR8/ANS1), IBV (PR8/BNS1), ICV (PR8/CNS1) and IDV (PR8/DN1) NS1 proteins, or without NS1 (PR8/ΔNS1). At 14 h post-infection, cells were fixed and stained for NS1 using HA epitope tag (top) or NP (bottom) antibodies (light blue). DAPI was used for nuclear staining (dark blue). Representative images were captured at 10x magnification. Scale bar: 100 μm. (D) Western blots: MDCK cells (2.5 × 10⁵ cells/well, 24-well plate format) were mock-infected or infected as above and protein expression levels for NS1 and NP were evaluated using HA epitope tag or NP antibodies as described above. Actin was used as a loading control. Molecular mass markers (in kDa) are indicated on the left.

