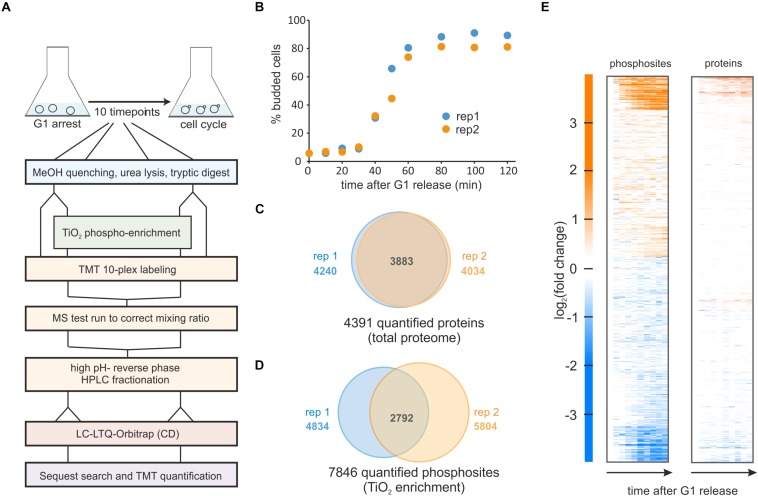
FIGURE 1.
Phospho-proteomics time course of yeast cells released synchronously from G1 on ethanol minimal medium. (A) Experimental workflow for sampling, phospho-enrichment, TMT labeling and mass spectrometry analysis. (B) Budding index of two replicate cultures released from a G1 arrest. (C) Total protein, and (D) Phosphorylated sites quantified in the two replicate experiments. (E) Heatmap of the averaged replicates (log2 fold changes relative to t = 0 min) for phosphorylated sites and quantified proteins.

