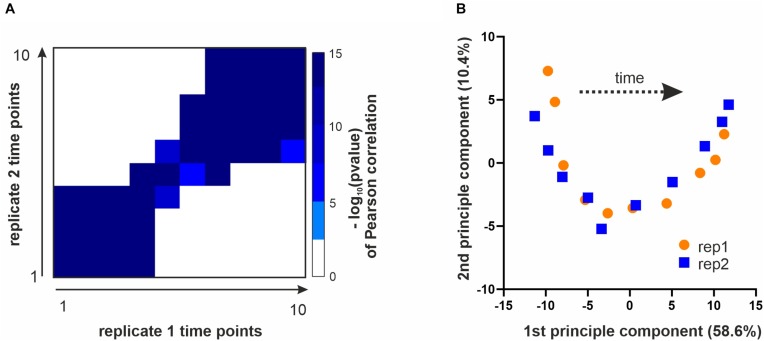
FIGURE 2.
Data overview and quality controls. (A) All time points of replicate 1 were correlated with all time points from replicate 2 (based on top 3rd ranking phosphosites, see section Materials and Methods). Shown is a heatmap of the –log10(p-value) of a Pearson correlation for all time points of one replicate with those of the other replicate. (B) Principle component analysis performed with the top 3rd of the identified phosphosites. Plotted are the ten time points of each replicate projected onto the first two principle components.

