FIGURE 5.
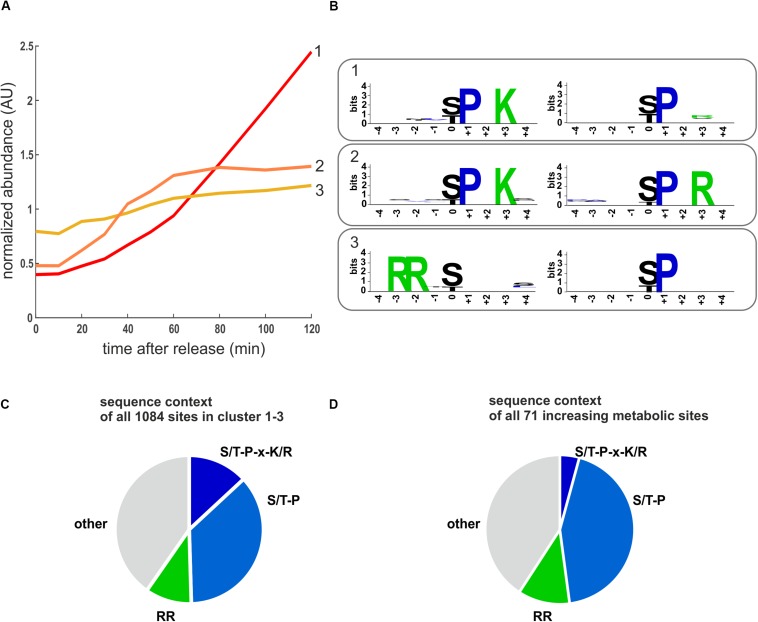
Motifs enriched in increasing phosphorylation sites. (A) Cluster averages of three increasing clusters identified by k-means clustering. (B) Enriched motifs identified in the increasing clusters using the motif-X algorithm. The two most enriched motifs for each cluster are shown (p < 10–6), the complete motif analysis for all clusters is reported in Supplementary Table 4. (C) Pie chart depicting the sequence context of all sites in the cell cycle increasing clusters 1–3. (D) Pie chart depicting the sequence context of the cell cycle increasing phosphosites on metabolic proteins. RR denotes motifs potentially recognized by PKA including RRxS, RRxxS, and RxRxS. S/T-P-x-K/R is the optimal CDK consensus site.

