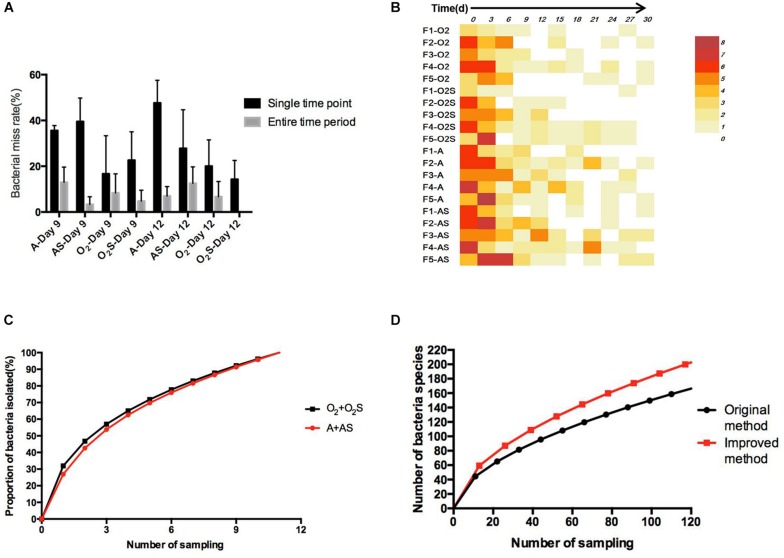
FIGURE 5.
(A) The proportion of bacteria missed in different groups at a single time point and over the entire time period. Results are shown as means ± SEM. (B) The number of bacteria not isolated from the sample taken at the previous time point compared with the number of bacteria isolated from the current sample. (C) The change in bacterial identification rate over time. (D) Equation fitted to the number of bacterial species depending on the workload before and after optimization of the method.

