Figure 5.
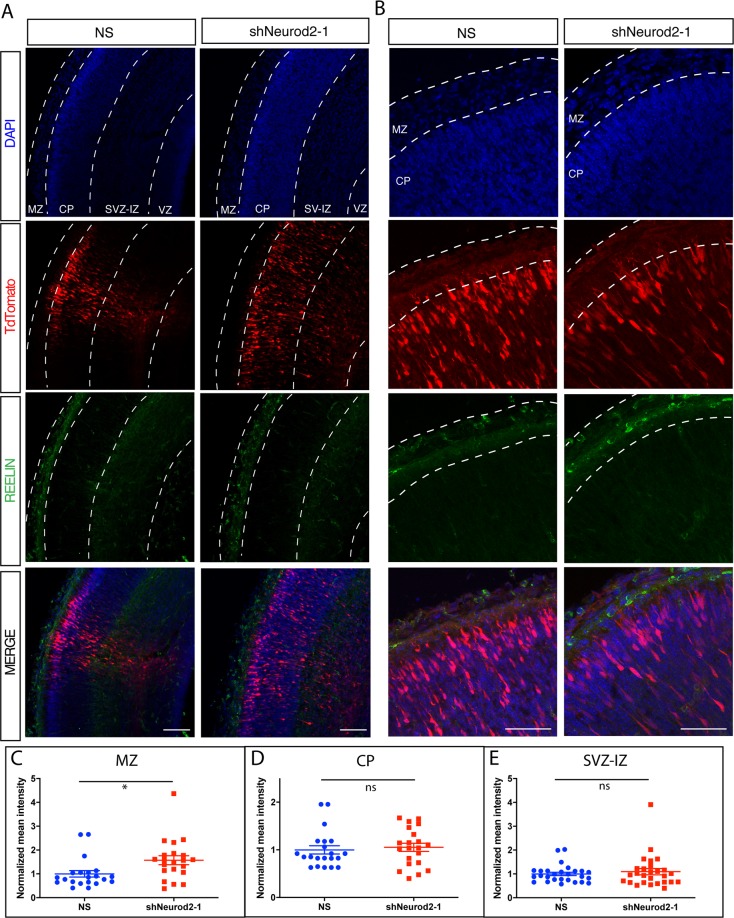
In vivo quantification of REELIN protein levels upon Neurod2 silencing in the embryonic cortex. (A) Embryos were electroporated with non-silencing or shNeurod2-1 shRNA and TdTomato at E14.5, cortices were harvested at E17.5 and confocal images were acquired after REELIN immunofluorescent staining. REELIN levels were not significantly altered within the CP, SVZ-IZ and VZ. However we observed a slight but significant increase in REELIN protein within the MZ. Scale bar: 100 µm. (B) Higher magnification images of those displayed in (A). Scale bar: 50 µm. (C–E) Quantification of images displayed in (A,B). A total of 21 images acquired from n = 3 embryos per group were used for quantification. *p = 0.02 by unpaired two-tailed t-test. Abbreviations: MZ (marginal zone), SVZ-IZ (subventricular-intermediate zone), CP (cortical plate), NS (non-silencing), ns (non-significant).

