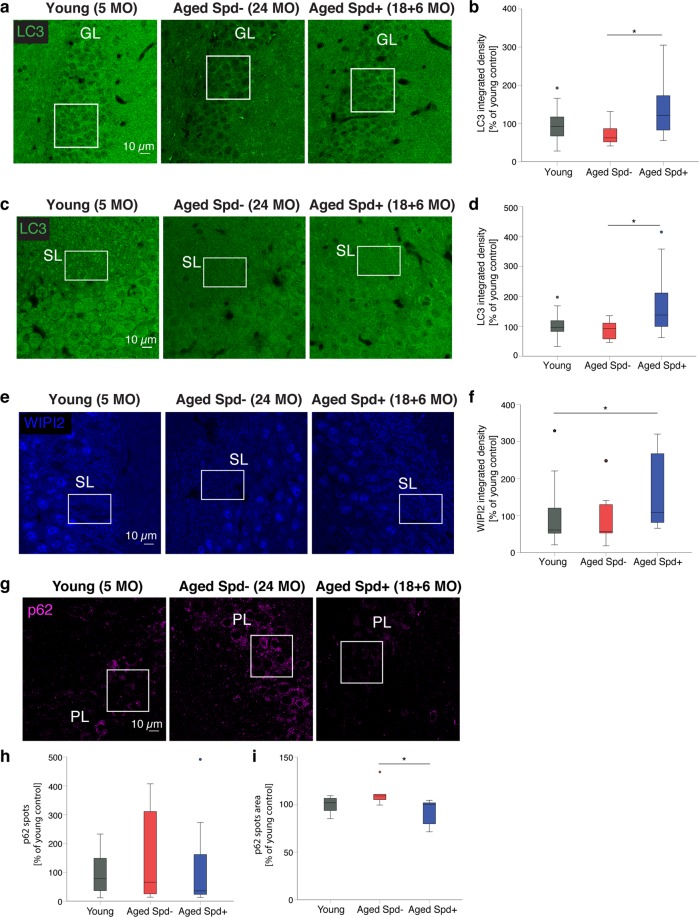
Figure 1.
Spermidine treatment increases LC3 and WIPI2 levels while reducing p62 in aged hippocampal neurons. (a) Confocal images of LC3 immunoreactivity in the dentate gyrus granule cell layer (GL) of young (5 months old), aged control (24 months old) and aged spermidine treated (18 + 6 months) mice. (b) GL LC3 integrated density (young: 100 ± 13, n = 14 mice; aged Spd−: 72 ± 9, n = 10 mice; aged Spd +: 134 ± 21, n = 12 mice, aged Spd− versus aged Spd+: p = 0.026907, one-way ANOVA with Tukey post-hoc test). (c) Representative confocal images of LC3 immunoreactivity in the CA3 stratum lucidum (SL) of young, aged control and aged spermidine treated mice. (d) SL LC3 integrated density (young: 100 ± 12, n = 14 mice; aged Spd−: 88 ± 9, n = 10 mice; aged Spd+: 172 ± 32, n = 12 mice; aged Spd− versus aged Spd +: p = 0.013770, Kruskal-Wallis test followed by Mann Whitney U test with Bonferroni correction with α set to 0.016667). Results represent 1–2 technical replicates. (e) Confocal images of WIPI2 immunoreactivity in the CA3 SL of young, aged control and aged spermidine treated mice. (f) SL WIPI2 integrated density (young: 100 ± 24, n = 14 mice; aged Spd−: 88 ± 22, n = 10; aged Spd+: 159 ± 29, n = 12 mice; young versus aged Spd+: p = 0.012670, Kruskal-Wallis test followed by Mann Whitney U test with Bonferroni correction with α set to 0.016667). (g) Confocal images of p62 immunoreactivity in the CA3 pyramidal layer (PL) of young, aged control and aged spermidine treated mice. (h) PL p62 spots number normalized to young controls (young: 100 ± 24, n = 10 mice; aged Spd−: 148 ± 68, n = 6 mice; aged Spd+:130 ± 69, n = 7 mice). (i) PL p62 spots area normalized to young controls (young: 100 ± 3; aged Spd−: 111 ± 5; aged Spd+: 91 ± 5; aged Spd− versus aged Spd+: p = 0.013986, Kruskal-Wallis test followed by Mann Whitney U test with Bonferroni correction with α set to 0.016667). ROIs indicate the area quantified within each image. *p < 0.05. Values represent mean ± SEM. Graphs show medians, interquartile ranges and min/max values. Circles are outliers and pentagons are extremes.

