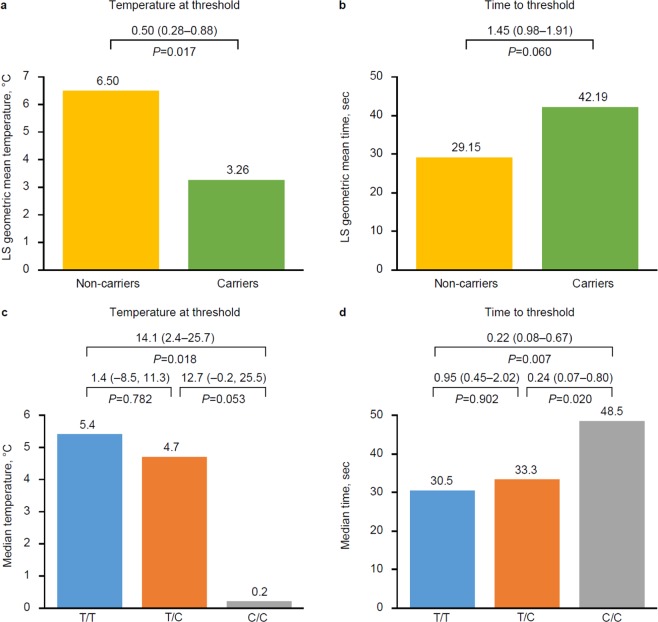
Figure 2.
Comparison of QST measurements for rs10166942 between carriers (allele [C]; n = 18) and non-carriers (allele [T]; n = 20) (a,b), and between genotypes (c,d). QST was performed using a Peltier thermode placed against the skin, which was then cooled at a rate of 1 °C per second (until 0 °C). The temperature and time at which the participant experienced the cold pain threshold were recorded. Differences between the groups are represented as means (or medians) with 95% confidence intervals.

