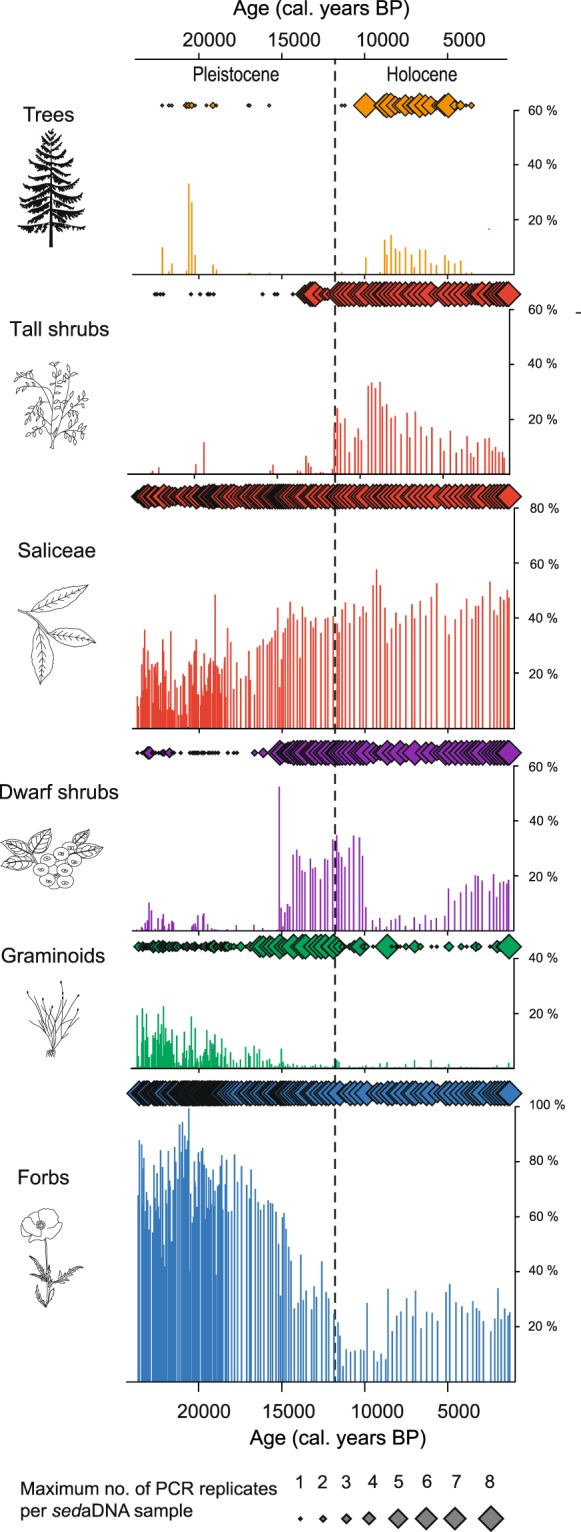
Figure 3.

Turnover in plant functional groups over the past 24,000 years. Selected functional groups are presented as a percentage of total sedaDNA reads per sample (histogram) and maximum number of PCR replicates (out of eight) per sample (diamond symbols) for the Lake Bolshoye Shchuchye record. Note that the height of the y-axis varies amongst panels. The grey dashed line indicates the Pleistocene-Holocene boundary. Botanical drawings of key plant taxa were created using Adobe Illustrator CC 2018 (https://www.adobe.com/uk/products/illustrator.html#).
