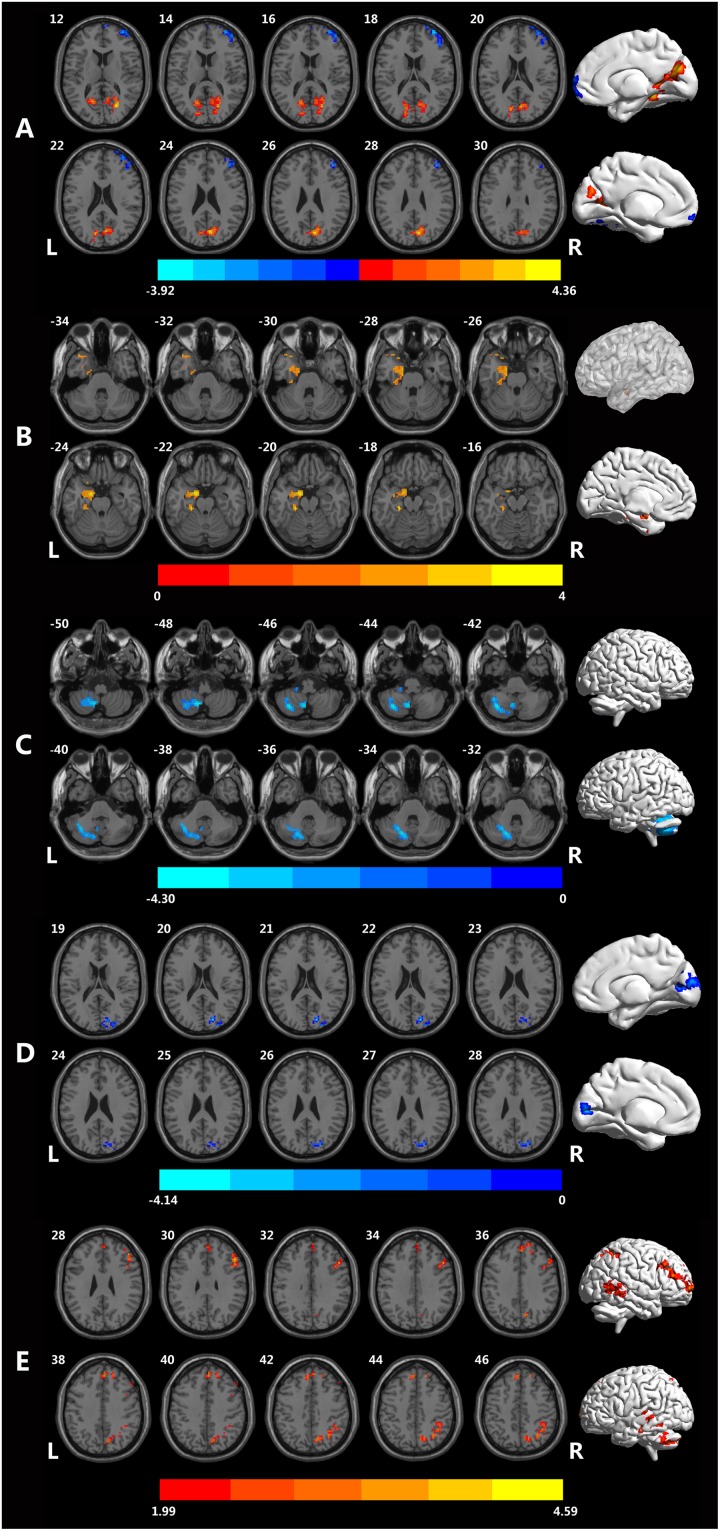
FIGURE 1.
Brain regions showing different rsfMRI values between the MCID and MCIND groups. (A) Brain regions with significant differences in fALFF between the MCID group and MCIND group. (B) Brain regions with significant differences in PerAF between the MCID group and MCIND group. (C) Brain regions with significant differences in ReHo between the MCID group and MCIND. (D) Brain regions with significant differences in dfALFF between the MCID group and MCIND group. (E) Brain regions with significant differences in dReHo between the MCID group and MCIND group (after GRF correction; voxel-wise p < 0.05, cluster-wise p < 0.05, two-tailed). The color bar indicates the T-value.

