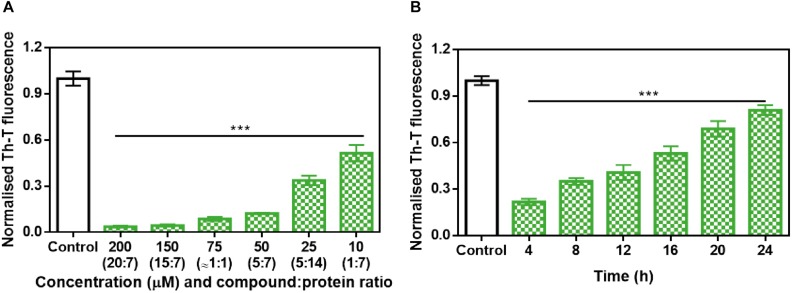
FIGURE 3.
Analysis of the inhibitory capacity of ZPD-2. (A) Titration of the effect of different concentrations of ZPD-2 on 70 μM α-Syn aggregation. (B) Th-T fluorescence of α-Syn end-point aggregates after the addition of ZPD-2 at different time points during the aggregation kinetics. Th-T fluorescence is plotted as normalized means. End-points were obtained at 48 h of α-Syn incubation. Error bars are shown as standard errors of mean values, ∗∗∗p < 0.001.

