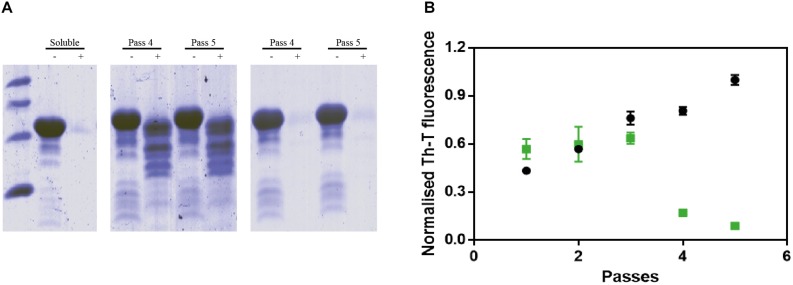
FIGURE 5.
PMCA of α-synuclein in presence of ZPD-2. (A) Tricine–SDS-PAGE gels of untreated (middle) and ZPD-2-treated (right) PMCA samples before (–) and after (+) being digested with proteinase K. (B) Th-T fluorescence of different PMCA cycles of treated (green) and untreated (black) samples. Soluble α-Syn and PMCA steps 4 and 5 are shown. Th-T fluorescence is plotted as normalized means. Error bars are shown as standard errors of mean values.

