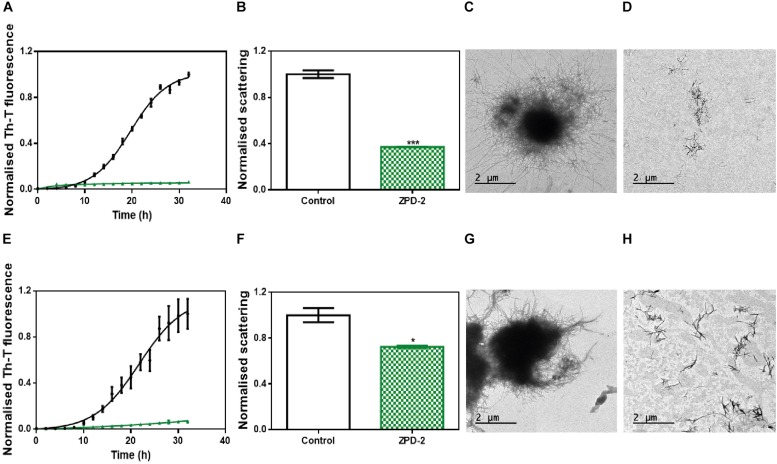
FIGURE 6.
ZPD-2 blocks the aggregation of two different α-synuclein strains. (A,E) Aggregation kinetics of α-Syn strains B (A) and C (E) in absence (black) and presence (green) of ZPD-2. (B,F) Light scattering final point measurements at 300 nm of untreated (white) and ZPD-2-treated samples (green) of strains B (B) and C (F). (C,D,G,H) Representative TEM images of untreated α-Syn aggregates (C,G) and treated (D,H) samples for strains B and C, respectively. Th-T fluorescence is expressed as normalized means. Final points were obtained at 48 h after the aggregation reaction begins. Error bars are shown as standard errors of mean values, where p < 0.05 and p < 0.001 were indicated by ∗ and ∗∗∗, respectively.

