Figure 2.
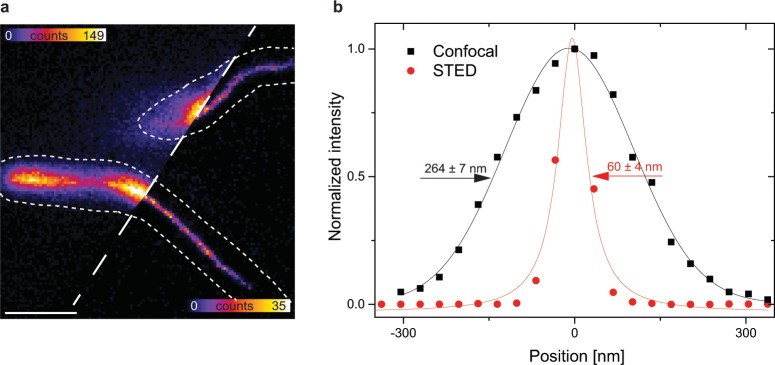
In vivo STED analysis in MSR-1 cells with TagRFP657-MamK. (a) Confocal and STED fluorescence image of MamK-TagRFP657 filaments in living MSR-1 along with an intensity line profile is plotted (dashed line) (b). Gaussian approximation for the exemplary confocal image in (a) provides a full-width at half maximum (FHWM) of 227 ± 6 nm (black) and Lorentzian fitting for STED image (a) results in a FHWM of 60 ± 4 nm (red). The error arises from fitting errors and not from multiple measurements. Line profiles represent normalized raw image data and fitting curves (fitted value ± standard error). Scale bar: 1 µm.

