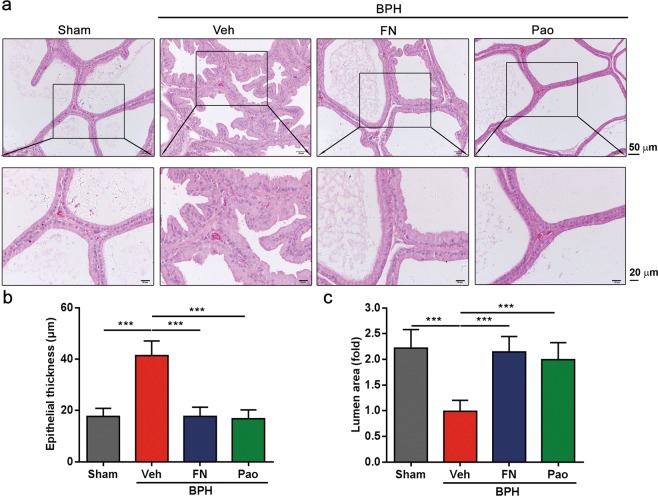
Figure 2.
The histopathological analysis of the prostate tissues in the testosterone-induced BPH rats after being treated with Pao extract. (a) H&E staining of the sham control, BPH/Veh, BPH/FN and BPH/Pao groups. The sections were photographed by microscope. The scale bars in photos above are 50 μm and in photos below are 20 μm. (b) Quantification of the thickness of epithelial layers; (c) quantification of the fold changes of the lumen areas among four groups. ***p < 0.001.

