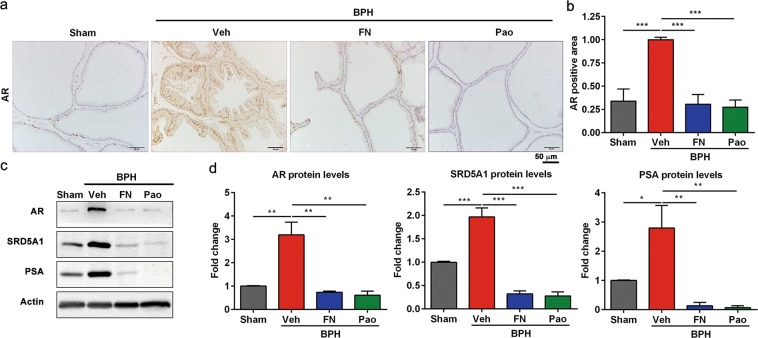
Figure 4.
Pao extracts downregulated the expression of AR, SRD5A1, and PSA. (a) IHC staining of AR in the sham control, BPH/Veh, BPH/FN and BPH/Pao groups. Scale bar, 50 μm. (b) Quantification of AR positive area in four groups. (c) Western blot analysis of AR, SRD5A1, and PSA protein expression in rat prostate tissues. (d) Quantification of AR, SRD5A1, and PSA protein expression levels in rat prostate tissues from four groups by Image J software. The values were presented as the mean ± SD of three independent experiments. *p < 0.05; **p < 0.01; ***p < 0.001.

