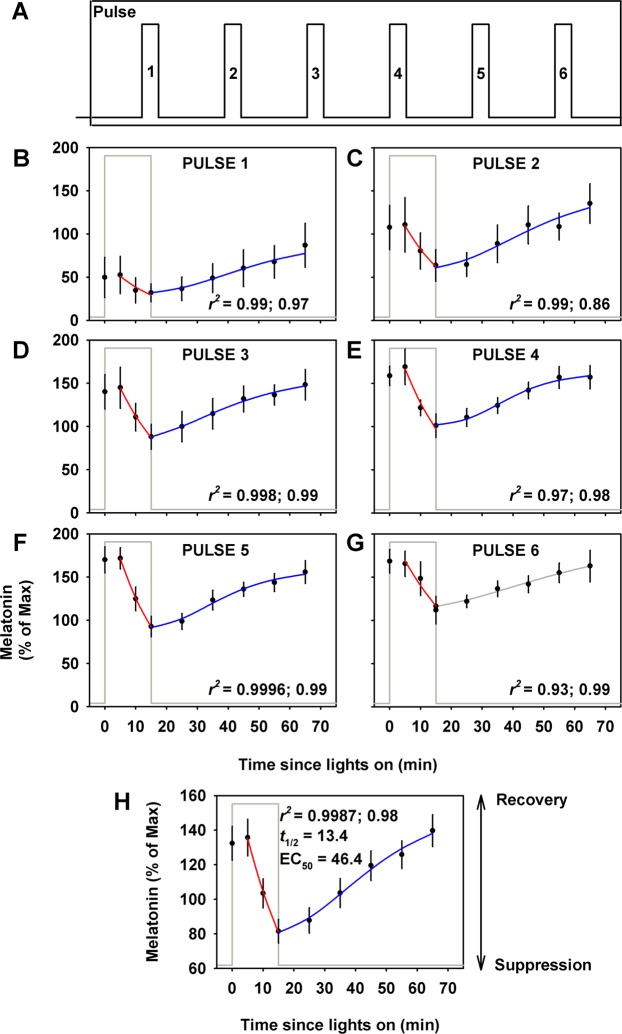
Figure 4.
Melatonin suppression and recovery dynamics. Linear and non-linear regression models were applied to group mean (±SEM) melatonin levels under intermittent light exposure. Stimulus pattern under the intermittent condition is shown for reference (A). Suppression regression-line is shown in red and recovery regression-line is shown in blue for each individual stimulus (B–G) and the group mean profile across all six stimuli (H). The recovery time-course for the last stimulus was under dim light after the 6.5 h exposure interval ended (gray line) and is shown for illustrative purposes and was not included in the recovery time-course profile analysis in (H). Adjusted r2 values from the regression analyses are shown for the suppression followed by the recovery interval; t1/2: half-life of suppression; EC50: half-maximal recovery. Data shown are group mean (±SEM).

