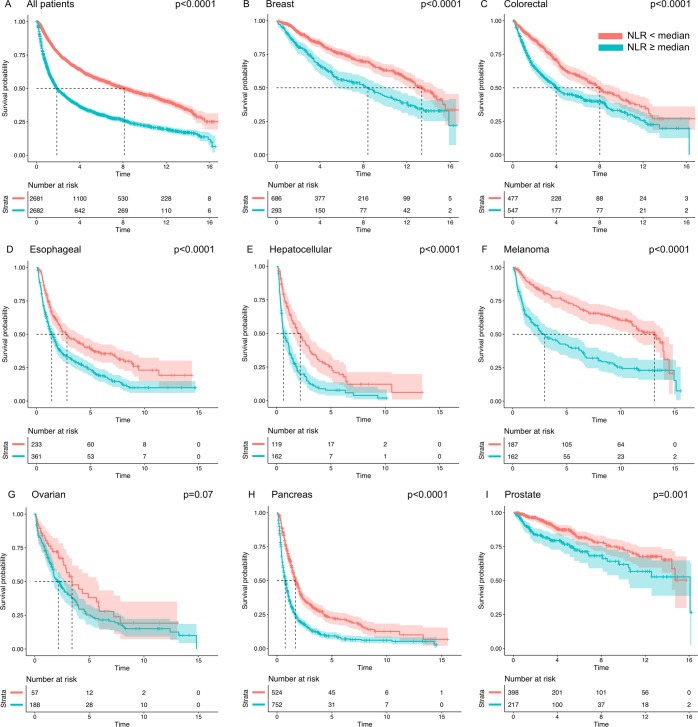
Figure 2.
Survival Analysis. Kaplan Meier survival curves demonstrating survival probability with increasing time post diagnosis in patients with above-median NLR (blue) as compared to below-median NLR (red) in the cohort as a whole (A) and for each studied cancer type (B–I). The shaded areas reflect 95% confidence intervals. The hatched lines show median survival time for patients above or below the median NLR. Group-specific medians for determining high NLR cutoff are calculated within each cancer subtype.

