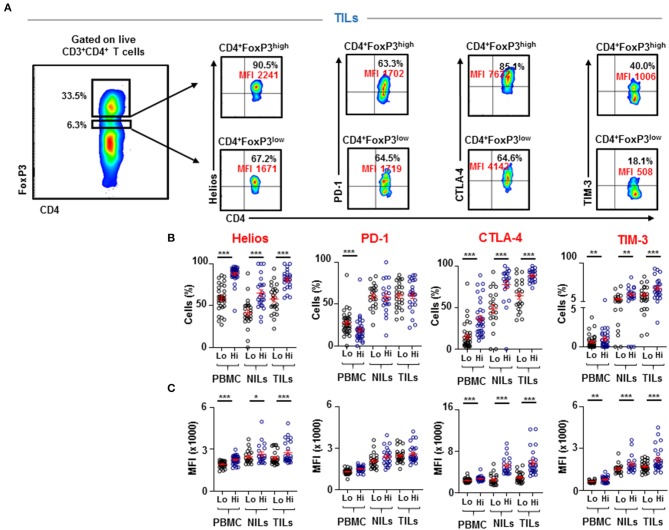
Figure 2.
Differences in Helios and immune checkpoint expression on CD4+FoxP3low and CD4+FoxP3high PBMC, NILs, and TILs from CRC patients. CD4+FoxP3low and CD4+FoxP3high Tregs were gated in PBMC, NILs, and TILs to investigate Helios, PD-1, CTLA-4, and TIM-3 expressions. Representative flow cytometric plots show gating strategy for defining CD4+FoxP3low/high Tregs and the expression levels of Helios, PD-1, CTLA-4, and TIM-3, in TILs isolated from CRC patients (A). Scatter plots show differences in expression level (B) and Mean Fluorescence Intensity (MFI) (C) of Helios, PD-1, CTLA-4, and TIM-3 between CD4+FoxP3low and CD4+FoxP3high PBMC, NILs, and TILs from CRC patients. ***P < 0.001, **P < 0.01.

