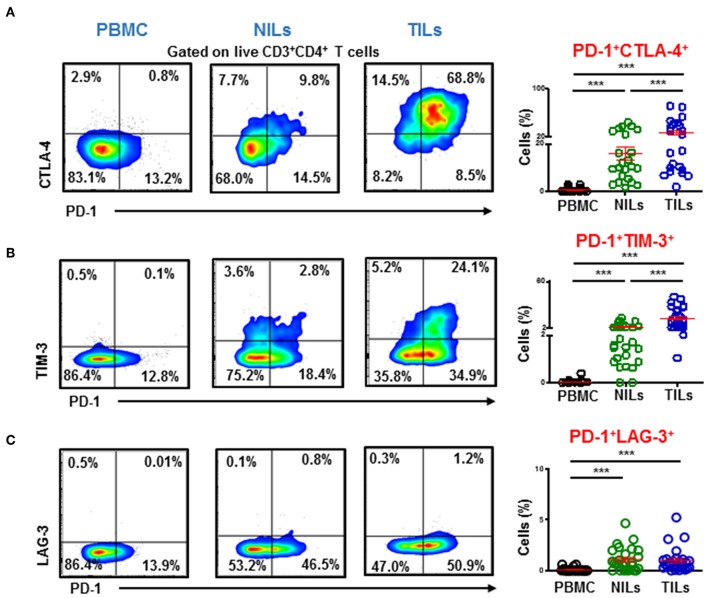
Figure 4.
Immune checkpoints co-expression on CD4+ T cells. PBMC, NILs, and TILs isolated from CRC patients were stained for CD3, CD4, and immune checkpoints. Representative flow cytometric and scatter plots show differences in co-expression levels of PD-1−/+CTLA-4−/+ (A), PD-1−/+TIM-3−/+ (B), and PD-1−/+LAG-3−/+ (C) on CD4+ T cells in PBMC, NILs, and TILs. ***P < 0.001.

