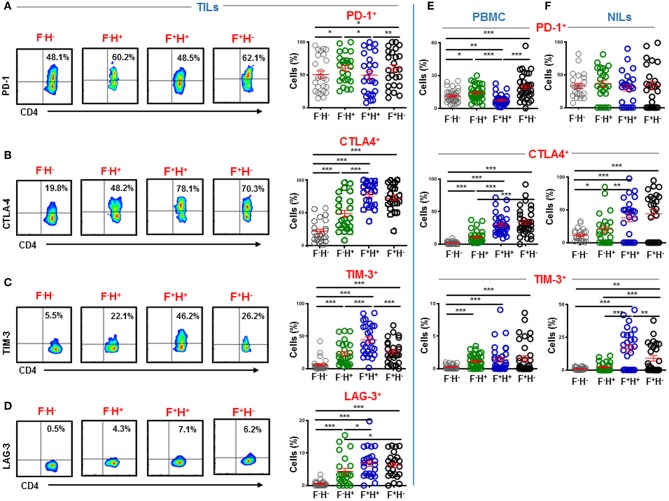
Figure 5.
Immune checkpoint expression on FoxP3 and Helios subsets in CD4+ TILs, PBMC, and NILs. TILs isolated from CRC patients were stained for CD3, CD4, immune checkpoints and FoxP3 and Helios. Representative flow cytometric plots and scatter plots show differences in expression levels of PD-1 (A), CTLA-4 (B), TIM-3 (C), and LAG-3 (D) in CD4+FoxP3−/+Helios−/+ TILs subsets. Scatter plots show differences in expression levels of PD-1, CTLA-4, and TIM-3 in CD4+FoxP3−/+Helios−/+ PBMC (E) and NILs (F) from CRC patients. ***P < 0.001, **P < 0.01, *P < 0.05.

