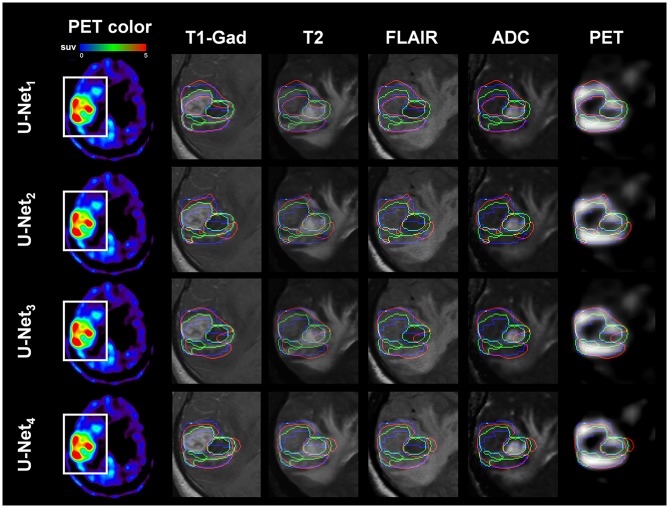
Figure 1.
Representative example of AMT-PET-learned MRI-based tumor volume: PM(x) (voxels inside red contour), where multi-modal MRI data of Patient No. 9 (images acquired with Siemens Protocol) were separately analyzed by U-Net1(Siemens) (1st row), U-Net2(Philips) (2nd row), U-Net3 (3rd row), and U-Net4 (4th row). Note that U-Net1(Siemens) and U-Net3 learned multi-modal MRI of Patient 9 and outperformed the other two U-Net systems to spatially match PM(x) with the target, AMT-PET tumor volume: P(x) (voxels inside blue contour); sensitivity/specificity/ PPV/NPV = 0.86/1.00/0.82/1.00, 0.41/1.00/0.51/1.00, 0.85/0.89/0.69/1.00, and 0.70/1.00/0.74/1.00 for U-Net1(Siemens), U-Net2(Philips), U-Net3 and U-Net4, respectively. For comparison, T1-Gad tumor volume: M(x) (voxels inside green contour) was superimposed. White box indicates the region of interest where T1-Gad, T2, FLAIR, ADC map, and AMT-PET slices were captured to show the contours.

