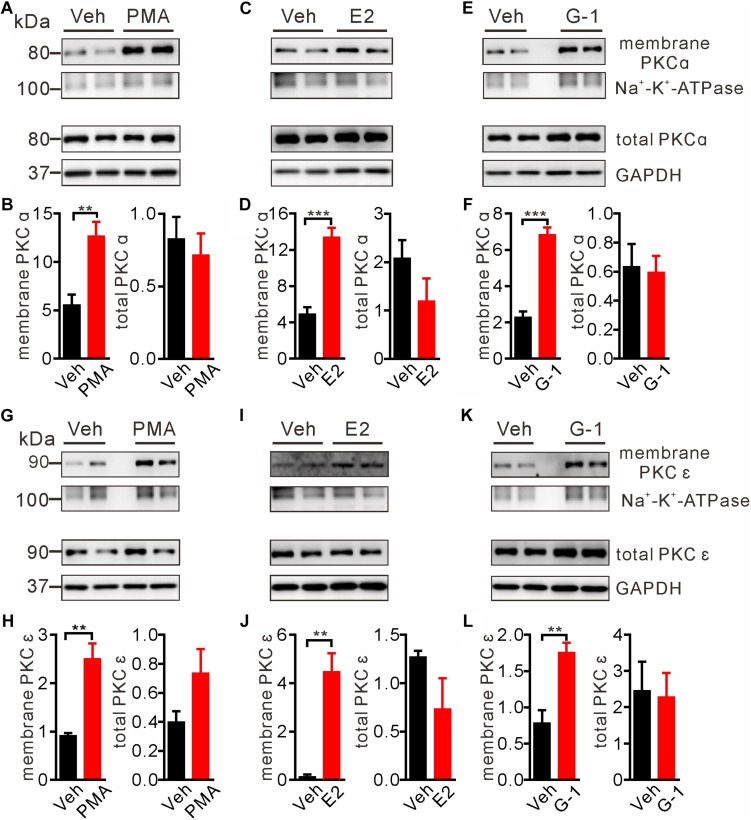
FIGURE 4.
E2 and G-1 promoted translocation of PKC isoforms to the plasma membrane. (A,B,G,H) Cells treated with the pan-PKC agonist PMA (1 μM) for 5 min had significantly higher PKCα and PKCε in the plasma membrane protein samples, compared with vehicle-treated cells. (C,D,I,J) Cells treated with E2 (1 μM) for 5 min had increased PKCα and PKCε in the plasma membrane protein samples as compared with cells treated with vehicle. (E,F,K,L) Cells treated with G-1 (1 μM) for 5 min had increased PKCα and PKCε in the plasma membrane protein samples as compared with cells treated with vehicle. After detected PKCα bands (C,E), the nitrocellulose membrane was stripped and re-blocked by 5% fat-free dry milk in TBST, followed by incubation with PKCε primary antibody, then PKCε bands was detected (I,K). So the loading controls are the same. Membrane PKCα or PKCε is a relative value with Na+-K+-ATPase as the internal reference for plasma membrane protein; total PKCα or PKCε is the relative value with GAPDH as the internal reference for total protein. ∗∗P < 0.01, ∗∗∗P < 0.001, unpaired t-test, averaged data from three to four independent experiments.

