FIGURE 5.
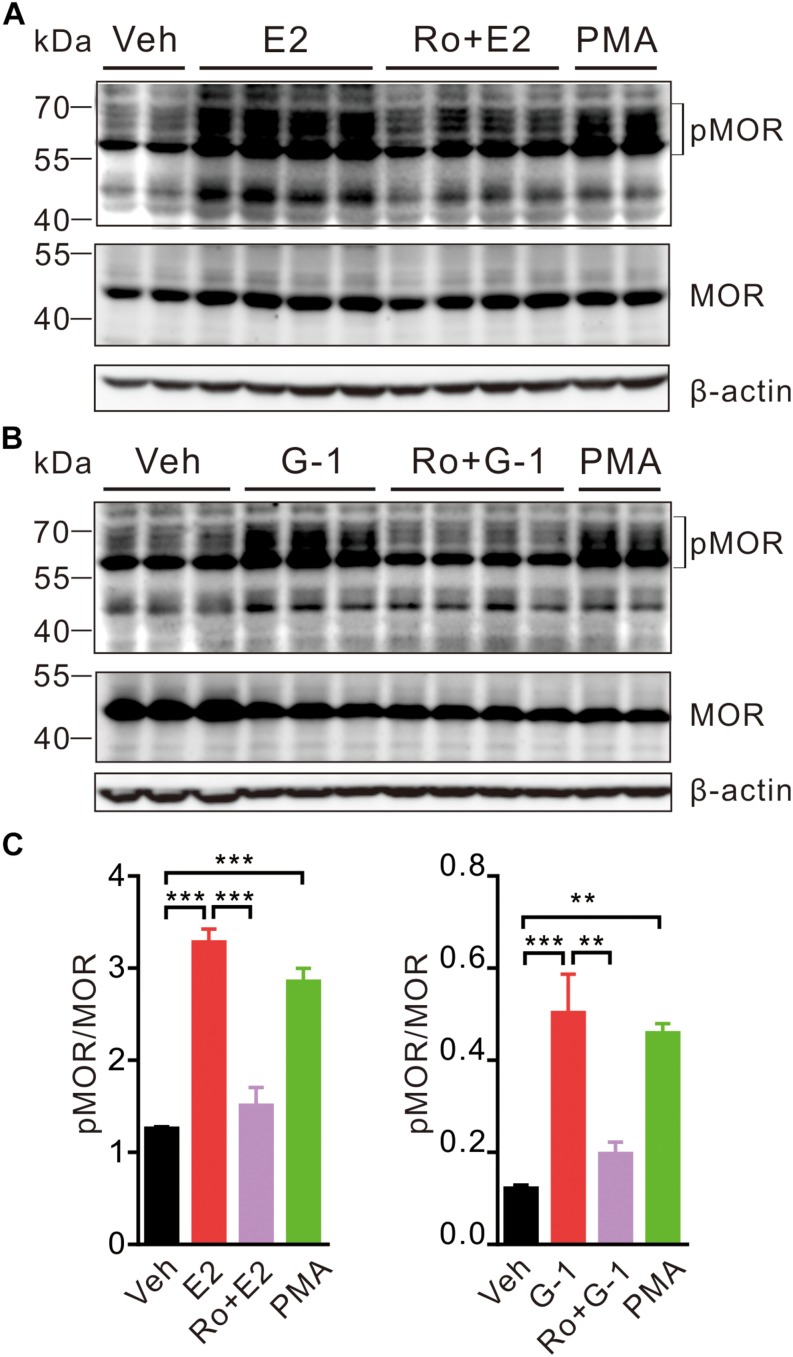
E2 and G-1 stimulate phosphorylation of MOR in a PKC-dependent manner. (A,B) SH-SY5Y cells treated with PMA (1 μM), E2 (1 μM), or G-1 (1 μM) for 30 min showed increased level of phosphorylated MOR (pMOR) as compared with the vehicle group. In the presence of the pan-PKC inhibitor (Ro 31-8820, Ro, 3 μM), E2 and G-1 failed to increase pMOR expression. (C) The averaged pMOR level (relative to β-actin) in cells with different treatments. After detection of pMOR (A,B), the nitrocellulose membrane was stripped and re-blocked by 5% fat-free dry milk in TBST, followed by incubation with MOR primary antibody, then MOR band was detected. ∗∗P < 0.01, ∗∗∗P < 0.001, one-way ANOVA with Tukey’s post hoc test, averaged data from three to four independent experiments.

