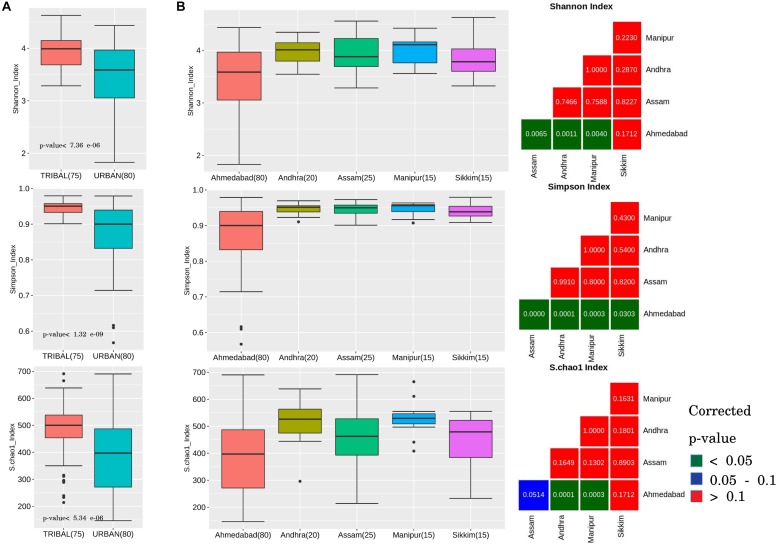
FIGURE 1.
Alpha diversity trends observed in gut microbiota samples across urban and tribal samples. Changes in the gut microbial community structure were observed in terms of alpha-diversity measures: Shannon index, Simpson index, and Chao index. (A) Box plots depicting community diversity comparison between urban and tribal groups. Tribal samples showed significantly higher diversity (BH-corrected p-values < 0.1) than urban cohorts. (B) Box plots depicting a similar pattern of higher diversity in tribes when compared between different geographical regions (Urban, Ahmedabad; Tribal, Andhra, Assam, Manipur, and Sikkim). For each alpha-diversity measure, viz. Shannon, Simpson, and Chao, statistical comparisons with corrected p-values corresponding to each paired geographical region comparison are shown as a sub-plot. The colors indicated in the legend provided for the figure can be used to interpret the statistical significance of the obtained corrected p-value.

