FIGURE 3.
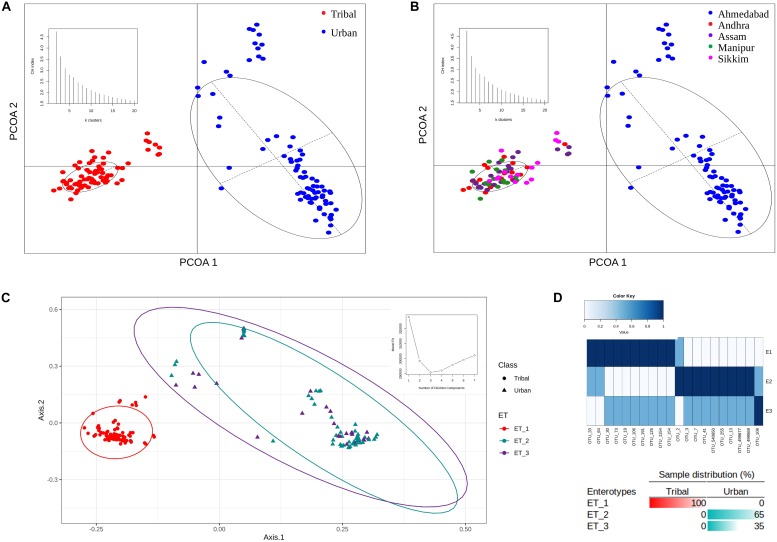
PCoA clustering of microbial abundance data based on Jensen–Shannon divergence. (A) Two distinct clusters were obtained for tribal and urban cohorts. (B) Clustering of all samples belonging to tribal and urban cohorts also revealed two distinct clusters, with all samples belonging to tribal geographical regions being clustered together and samples belonging to the urban region being segregated in a separate cluster. The inset depicts the optimal number of clusters obtained using the CH-index. (C) Enterotypes were identified that putatively drive the clustering pattern. The inset depicts the identification of the optimal number of enterotypes according to the model fit. (D) Sample distributions, with the top 20 OTU contributions to the identified enterotypes represented as an inset. Three enterotypes were observed, with ET_1 having OTUs specific to the tribal cohort and ET_2 having OTUs specific to the urban cohort, while ET_3 had a shared OTU profile of OTUs belonging to ET_1 and ET_2.

