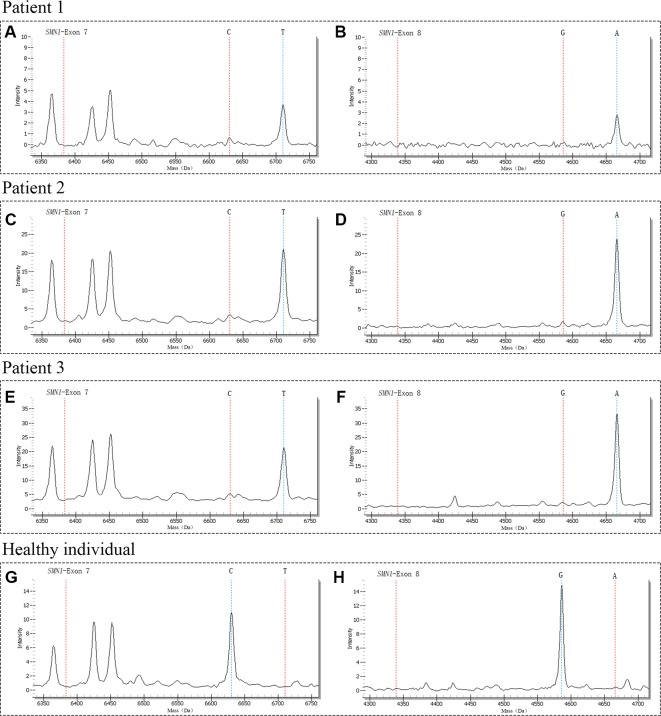
Figure 3.
The mass spectra of SMA-affected positive patients and healthy individual. Patient 1 had only one peak at 6710.3 Da (A) and 4665.9 Da (B) respectively, indicating the homozygous deletions of SMN1 exons 7 and 8; Patient 2 had only one peak at 6710.3 Da (C) and 4665.9 Da (D) respectively, indicating the homozygous deletions of SMN1 exons 7 and 8; Patient 3 had only one peak at 6710.3 Da (E) and 4665.9 Da (F) respectively, indicating the homozygous deletions of SMN1 exons 7 and 8; The control of healthy individual had only one peak at 6630.3 Da (G) and 4586.0 Da (H) respectively, indicating with normal copy number of SMN1. The red vertical dotted lines on the left indicate the mass of unextension primer, the red and blue vertical dotted lines on the right indicate the mass of primer after extension.

