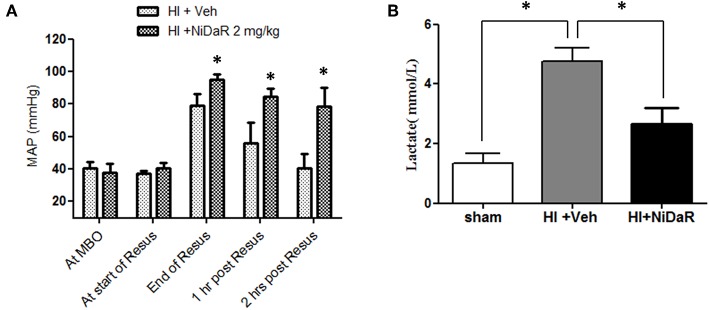
Figure 3.
Effect of NiDaR on MAP and plasma lactate following hemorrhagic shock. (A) MAP following HI and treatment with NiDaR at maximum bleed out (MBO), start of resuscitation, end of resuscitation, 1 and 2 h post resuscitation. Bars represent mean ± SEM. *p < 0.05 vs. HI + Veh. (B) Plasma lactate levels in sham, HI + Veh, HI + NiDaR treatment groups; n = 5–6 in each group; bars represent mean ± SEM; *indicates p < 0.05.

