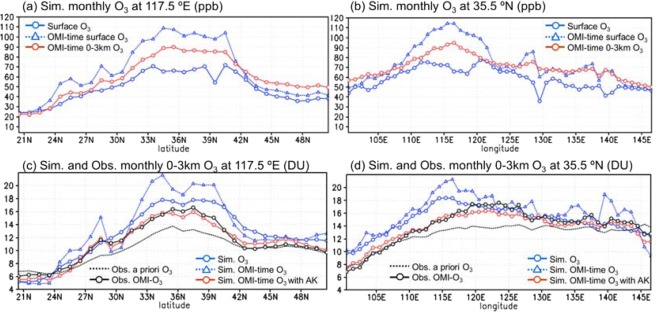
Figure 2.
Cross sections of monthly mean simulated and observed lower tropospheric O3. The cross sections of monthly mean (a,b), surface O3 mixing ratio (ppb) and (c,d), 0–3 km O3 column amount (DU) at (a,c), 117.5°E and (b,d), 35.5°N. a,b, The blue solid and dashed lines indicate the monthly mean values of simulated hourly O3 and OMI-time O3, respectively. The red line indicates the monthly mean OMI-time 0–3 km averaged O3 (after the screening). (c,d) The black solid and dashed lines indicate the retrieved OMI-O3 and the a priori O3 used for the retrieval, respectively. The blue solid and dashed lines indicate the monthly mean values of simulated hourly O3 and OMI-time O3 (after the screening), respectively. The red line indicates the monthly mean simulated OMI-time 0–3 km O3 column amount with AK.

