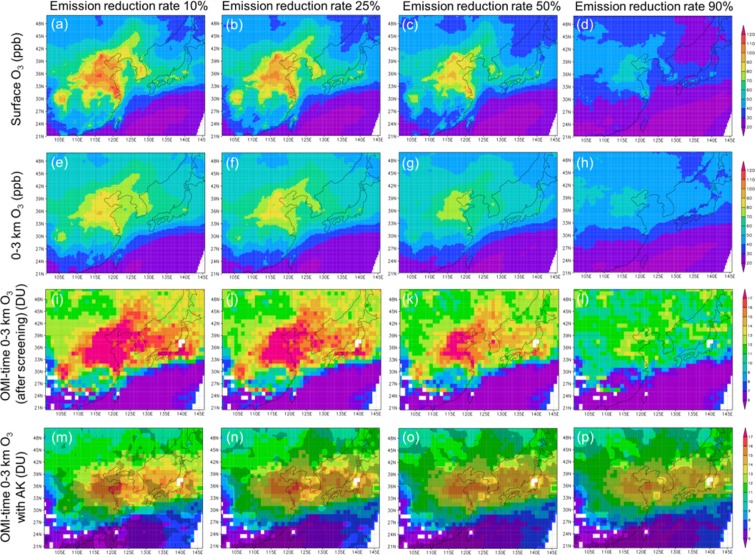
Figure 3.
Simulated lower tropospheric O3 responses to its precursor emission changes. The monthly mean simulated (top to bottom) surface O3 (ppb), 0–3 km mean O3 (ppb), OMI-time 0–3 km O3 column amount (after the screening) (DU), and OMI-time 0–3 km O3 column amount with AK (DU) at the different emission reduction levels of the precursor gases, (left to right), 10%, 25%, 50%, and 90% of the control level. The hatched areas indicate the grids where the simulated O3 with AK is significantly smaller than that for the control level of precursor gases emissions at a one-sided 95% confidence interval.

