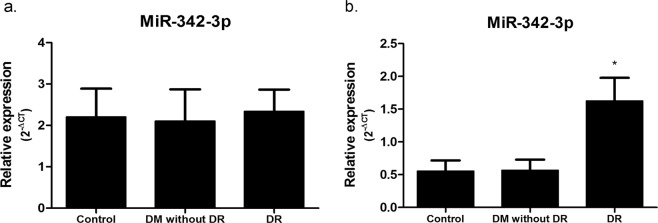
Figure 4.
Effect of normalization on the expression of MiR-342-3p in DR, DM without DR and healthy control patients. Relative expression of DR patients (n = 62) was compared with DM without DR (n = 48) and healthy control patients (n = 60). The expression levels (2−ΔCt) of MiR-342-3p are presented as mean fold changes ± standard errors. Significance was calculated by one-way ANOVA test with post-hoc Tukey test. Results with p values < 0.05 were considered significant.

