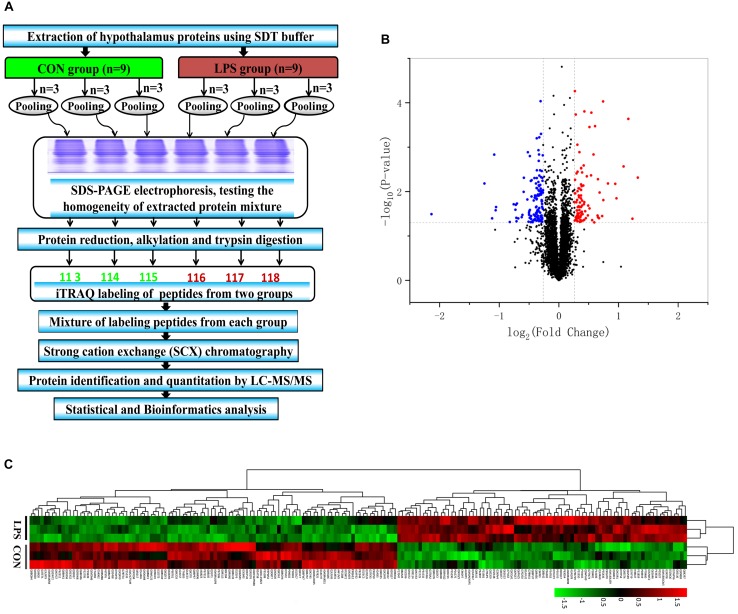
FIGURE 2.
iTRAQ-based proteomic analysis of hypothalamus samples from LPS mice and controls. (A) Workflow diagram. The proteins were subjected to iTRAQ labeling followed by mass spectrometric analysis. (B) Volcano plot of all 4787 identified proteins quantified by proteomic analysis from the LPS and CON groups, respectively. One hundred eighty-seven proteins with at least 1.20-fold changes at P < 0.05 relative to the controls were identified in the two groups. Non-significantly changed, significantly downregulated, and upregulated proteins are shown in black, blue, and red, respectively. (C) Heatmap of the 187 different proteins in the comparing the LPS and CON groups. The heatmap was plotted based on the levels of the differential proteins. The heatmap data was normalized using Z-scores. Distinct separation was observed between control and LPS-depressed mice. Rows: Samples; Columns: proteins. The color intensity indicates the protein expressional level as displayed: red, highest; green, lowest.

