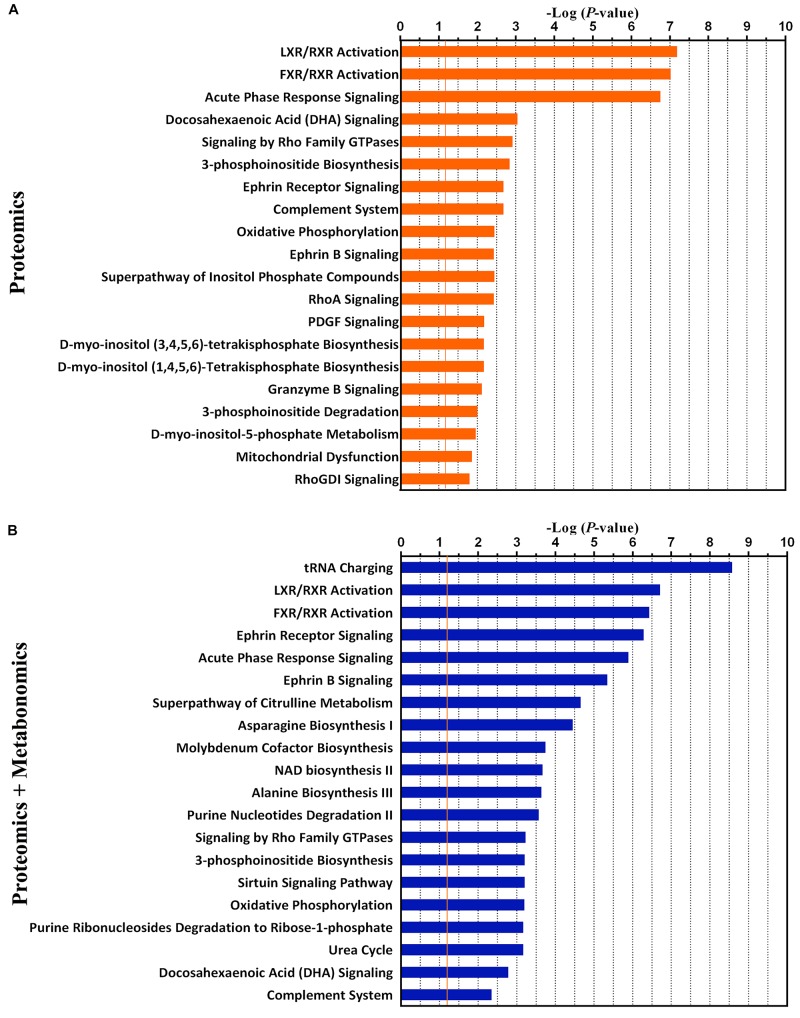
FIGURE 4.
The top 20 canonical pathways of proteomics data only (A) and the combination of proteomics and metabolomics (B) by the Ingenuity Pathway Analysis (IPA). The P-value was obtained by Fisher’s exact test. The Y-axis represents the canonical pathway terms, and the X-axis represents the -Log10 (P-value).

