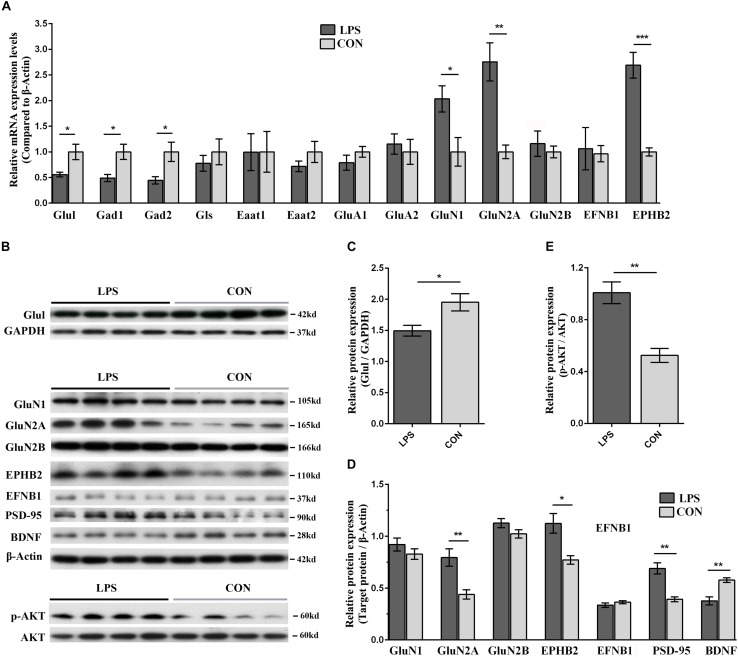
FIGURE 7.
Validation of key players in Ephrin receptor signaling and glutamatergic transmission in the hypothalamus of LPS-induced depressed mice in both the mRNA and protein levels. (A) Transcriptional profiling of glutamatergic transmission-related proteins and Ephrin receptor signaling-related proteins. The mRNA changes were detected by qRT-PCR. All samples were normalized to the β-Actin gene as a control. The fold increase or decrease was relative to the CON group as the reference. (B) Immunoblotting validation of centering on EPHB2-NMDAR-AKT cascade related key proteins. The abundance of Glul, GluN1, GluN2A, GluN2B, EPHB2, EFNB1, PSD-95, BDNF, p-AKT, and AKT was determined using their corresponding specific antibodies. Equal amounts of protein fractions were loaded. (C–E) The expression of Glul (C), GluN1, GluN2A, GluN2B, EPHB2, EFNB1, PSD-95, BDNF (D), p-AKT, and AKT (E) was quantified according to the corresponding bands of proteins in (B). GAPDH and β-Actin protein were used as the internal reference marker and loading control for normalization, respectively. All samples were validated in triplicate. The bands for the same proteins were analyzed by densitometry using Quality One software (version 4.6.6). Student’s t-test was utilized to analyze the significant difference between two groups. Values are presented as the means ± SEM (n = 5/group in qRT-PCR test, n = 4/group in WB test). ∗P < 0.05, ∗∗P < 0.01, ∗∗∗P < 0.001, LPS vs. CON.

