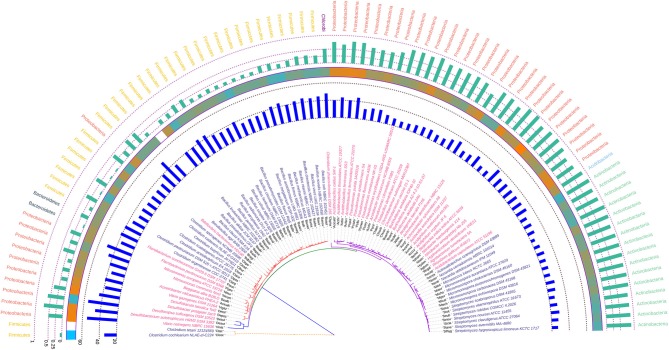
Figure 6.
Phylogenetic tree showing the relationship between the soil bacterial species considered in this study based on atpD gene sequences along with Gram nature, taxonomic position and codon usage annotation data. The name of the species have been depicted in color corresponding to its Gram nature with magenta and blue representing Gram negative and positive, respectively. The outermost semicircle with green bars represents the GC3 content of atpD sequences while the innermost semicircle with blue bars represents the Nc of the atpD coding sequences. The middle strip with cyan to orange color gradient depicts the variation in hydrophobicity of the protein encoded by the atpD coding sequences. The evolutionary history was inferred by using the Maximum Likelihood method based on the General Time Reversible model (Nei and Kumar, 2000). The bootstrap consensus tree inferred from 1,000 replicates is taken to represent the evolutionary history of the taxa analyzed (Felsenstein, 1985). Initial tree(s) for the heuristic search were obtained automatically by applying Neighbor-Join and BioNJ algorithms to a matrix of pairwise distances estimated using the Maximum Composite Likelihood (MCL) approach, and then selecting the topology with superior log likelihood value. A discrete Gamma distribution was used to model evolutionary rate differences among sites [five categories (+G, parameter = 0.9877)]. The rate variation model allowed for some sites to be evolutionarily invariable ([+I], 6.2680% sites). All positions containing gaps and missing data were eliminated. There were a total of 1,123 positions in the final dataset. Evolutionary analyses were conducted in MEGA6 (Kumar et al., 2008). The visualization and annotation of the phylogenetic tree was done using iTOL ver. 4.4.2 (Letunic and Bork, 2007).

