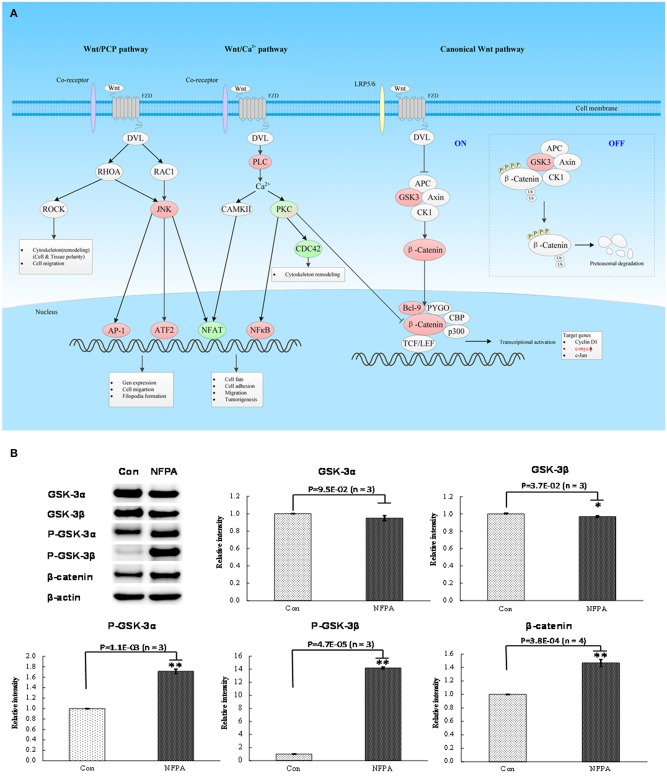
Figure 5.
Wnt signaling pathway was involved in NFPA. (A) Wnt signaling pathway was derived from PTMScan results of NFPAs compared to controls. The red color means upregulation of a molecule in NFPAs, and the green color means downregulation of a molecule in NFPAs. The gradient color degree means slightly different expression tendency of that molecule. (B) Activation of canonical Wnt pathway in NFPAs was verified by Western blot results of GSK-3α, GSK-3β, p-GSK-3β (Ser9), p-GSK-3α/β (Ser21/9), β-catenin and β-actin in control pituitaries (Con) and NFPAs (n ≥ 3). The relative intensity was the ratio of absorbance units of NFPAs compared to Con. *p < 0.05, **p < 0.01.

