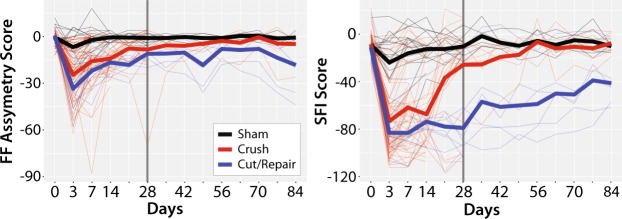
Figure 4.
Longitudinal behavioral data after sham (black lines), crush (red lines) and cut/repair injuries (blue lines). Results are shown for both FF (left panel) and SFI (right panel). The longitudinal time course (from injury to euthanasia) for each individual animal is plotted with thin lines, while the mean time course within each cohort is plotted with thick lines. Note the sharp decay in FF and SFI for both cohorts immediately after surgery, with the largest contrast between injury types at 4 weeks (vertical black dashed line). These results indicate a faster behavioral recovery following crush relative to cut/repair injuries, with crush injuries nearly recovered by four weeks.

