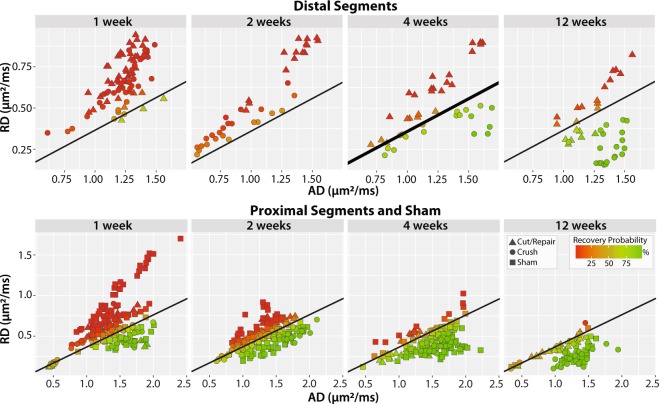
Figure 5.
Scatterplots of radial vs. axial diffusivities for distal segments (top panel), proximal segments (bottom panel), and sham nerves (bottom panel). The SVM boundary was generated using the distal data at four weeks (thick black line) and tested using data from the other panels (thin black line). Each point represents the mean cross-sectional (or slice-wise) value. Recovery probabilities are color-coded from non-recovery (red, above the SVM boundary) to recovery (green, below the SVM boundary). Consistent with the behavioral findings in Fig. 4, the model indicates that crush injuries are recovered distally by the 4th week, while cut/repair nerves are not. By the 12th week, however, cut/repair nerves are found on both sides of the decision boundary (green/red triangles), indicating different probabilities of recovery. This model was further tested in sham nerves and the proximal regions of injured nerves (bottom panel), nearly all of which showed a high probability of recovery by the 4th week.

